
Mathematics, 26.02.2021 19:30 codycollier
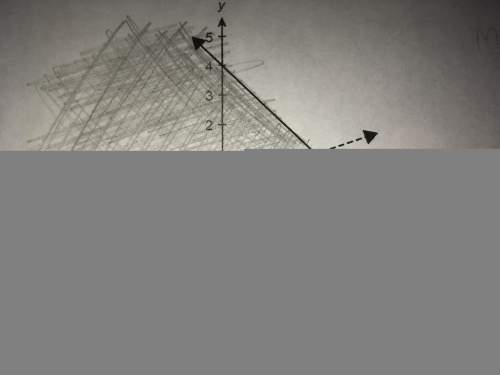
The graph below shows the population for a town during each year of a 7-year period.
POPULATION GROWTH
.
Population (thousands)
0
1 2 3 4 5 6 17
Year
Which equation best fits the data, where x is the year and y is the population in thousands?
o y=1.5(1.25)
Oy=x? +1.5
y = 5.52 + 1.5
o y = 1.5(0.25)

Answers: 3


Another question on Mathematics
Mathematics, 21.06.2019 16:00
The step function g(x) is defined as shown.what is the range of g(x)? ***answer choices in picture.
Answers: 3
Mathematics, 22.06.2019 00:00
Define the type of sequence below. 7, 14, 28, 56, 112, a. neither arithmetic nor geometric b. arithmetic c. both arithmetic and geometric d. geometric
Answers: 1
You know the right answer?
The graph below shows the population for a town during each year of a 7-year period.
POPULATION GRO...
Questions


English, 15.04.2021 19:10
Mathematics, 15.04.2021 19:10

Computers and Technology, 15.04.2021 19:10


History, 15.04.2021 19:10

Social Studies, 15.04.2021 19:10
Mathematics, 15.04.2021 19:10
Mathematics, 15.04.2021 19:10
Social Studies, 15.04.2021 19:10
History, 15.04.2021 19:10
Social Studies, 15.04.2021 19:10
Mathematics, 15.04.2021 19:10
Mathematics, 15.04.2021 19:10
SAT, 15.04.2021 19:10


