
Mathematics, 26.02.2021 23:40 carliefox26
Pls help! will give brainlist!
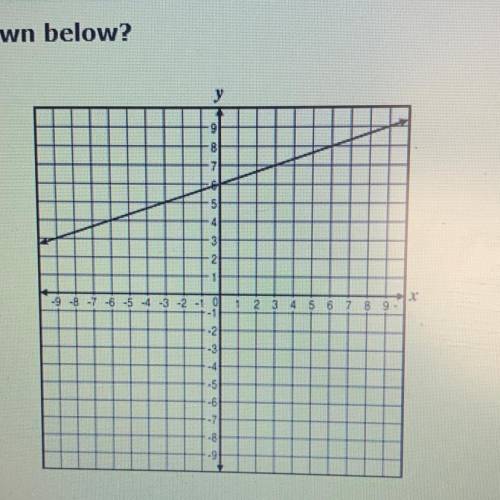
which equation is best represented by the graph shown above?
a. y = - 1/3x - 6
b. y = 6x + 1/3
c. y = - 6x + 1/3
d. y = 1/3x + 6

Answers: 3


Another question on Mathematics
Mathematics, 20.06.2019 18:04
Question 1 (50 points) your friend, taylor, missed class today and needs some identifying solutions to systems. explain to taylor how to find the solution(s) of any system using its graph. question 2 (50 points) taylor graphs the system below on her graphing calculator and decides that f(x)=g(x) at x=0, x=1, and x=3. provide taylor some feedback that explains which part of her answer is incorrect and why it is incorrect. f(x)=2x+1g(x)=2x2+1
Answers: 1
Mathematics, 21.06.2019 15:30
Aiden drives to school and back each day. the school is 16 miles from his home. he averages 40 miles per hour on his way to school. if his trip takes 1 hour, at approximately what speed does aiden drive home?
Answers: 1
Mathematics, 21.06.2019 17:20
Read the situations in the table below. then drag a graph and equation to represent each situation. indicate whether each of the relationships is proportional or non-proportional. edit : i got the right answer its attached
Answers: 2
Mathematics, 22.06.2019 00:00
(20 points) a bank has been receiving complaints from real estate agents that their customers have been waiting too long for mortgage confirmations. the bank prides itself on its mortgage application process and decides to investigate the claims. the bank manager takes a random sample of 20 customers whose mortgage applications have been processed in the last 6 months and finds the following wait times (in days): 5, 7, 22, 4, 12, 9, 9, 14, 3, 6, 5, 15, 10, 17, 12, 10, 9, 4, 10, 13 assume that the random variable x measures the number of days a customer waits for mortgage processing at this bank, and assume that x is normally distributed. 2a. find the sample mean of this data (x ě…). 2b. find the sample variance of x. find the variance of x ě…. for (c), (d), and (e), use the appropriate t-distribution 2c. find the 90% confidence interval for the population mean (îľ). 2d. test the hypothesis that îľ is equal to 7 at the 95% confidence level. (should you do a one-tailed or two-tailed test here? ) 2e. what is the approximate p-value of this hypothesis?
Answers: 2
You know the right answer?
Pls help! will give brainlist!
which equation is best represented by the graph shown above?
Questions


Mathematics, 29.07.2019 04:30

English, 29.07.2019 04:30
History, 29.07.2019 04:30
History, 29.07.2019 04:30


