
Mathematics, 27.02.2021 01:00 sam10146
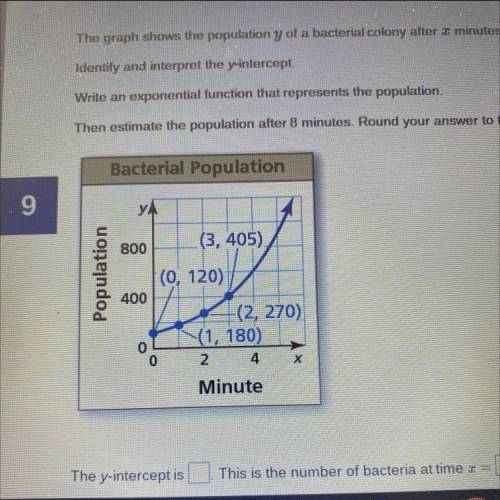
The graph shows the population y of a bacterial colony after I minutes.
Identify and interpret the y-intercept.
Write an exponential function that represents the population.
Then estimate the population after 8 minutes. Round your answer to the nearest whole number.
IM BEGGING U PLS ANSWER

Answers: 1


Another question on Mathematics
Mathematics, 21.06.2019 18:20
The total cost of anja’s trip to the dentist was $628.35. she paid a flat fee of $89.95 which included the checkup and cleaning and then had 4 cavities filled, each of which cost the same amount. which shows the correct equation and value of x, the cost of each cavity filling?
Answers: 2
Mathematics, 21.06.2019 18:40
Which of the following would be a good name for the function that takes the weight of a box and returns the energy needed to lift it?
Answers: 1
You know the right answer?
The graph shows the population y of a bacterial colony after I minutes.
Identify and interpret the...
Questions
Mathematics, 30.08.2021 21:40

Mathematics, 30.08.2021 21:40

English, 30.08.2021 21:40
Mathematics, 30.08.2021 21:40
Mathematics, 30.08.2021 21:40
Mathematics, 30.08.2021 21:40
Mathematics, 30.08.2021 21:40
Mathematics, 30.08.2021 21:40

Mathematics, 30.08.2021 21:50
History, 30.08.2021 21:50
Mathematics, 30.08.2021 21:50


