
Mathematics, 27.02.2021 01:00 bigmouth804
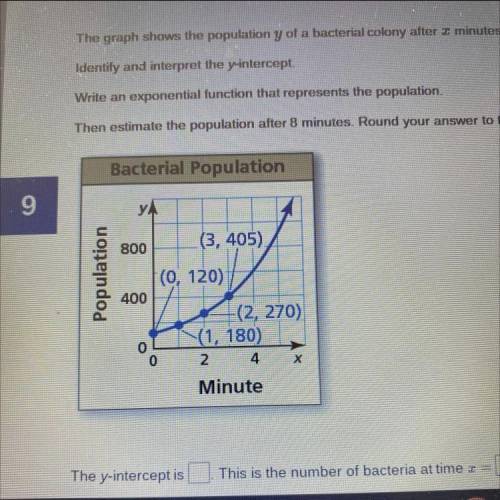
The graph shows the population y of a bacterial colony after I minutes.
Identify and interpret the y-intercept.
Write an exponential function that represents the population.
Then estimate the population after 8 minutes. Round your answer to the nearest whole number.
IM BEGGING U PLS ANSWER 20 points

Answers: 2


Another question on Mathematics
Mathematics, 21.06.2019 18:30
For each polynomial, determine the degree and write the polynomial in descending order. a. –4x^2 – 12 + 11x^4 b. 2x^5 + 14 – 3x^4 + 7x + 3x^3
Answers: 2
Mathematics, 21.06.2019 23:30
In the equation sqrt(n+5)-sqrt(11-10)=1. what is the value of n
Answers: 1
Mathematics, 22.06.2019 00:00
Find the percent cost of the total spent on each equipment $36, fees $158, transportation $59 a. 14%, 62%, 23% b. 15%, 60%, 35% c. 10%, 70%, 20% d. 11%, 62%, 27%
Answers: 3
Mathematics, 22.06.2019 00:00
What is the effect on the graph of the function f(x) = x2 when f(x) is changed to f(x) − 4?
Answers: 1
You know the right answer?
The graph shows the population y of a bacterial colony after I minutes.
Identify and interpret the...
Questions


World Languages, 14.07.2020 20:01

Social Studies, 14.07.2020 20:01
Mathematics, 14.07.2020 20:01

Computers and Technology, 14.07.2020 20:01


English, 14.07.2020 20:01


