
Mathematics, 27.02.2021 04:40 umezinwachukwuebuka1
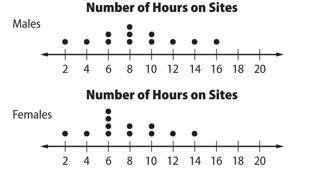
. The dot plot shows the number of hours students spent last week on social networking sites. Which is NOT an inference that can be made about the two populations?
A. Females typically spend more time than males on the sites.
B. Females typically spend less time than males on the sites.
C. The range for males is greater than the range for females.
D. The interquartile range for the males is 4 hours.

Answers: 3


Another question on Mathematics
Mathematics, 21.06.2019 14:00
In the film, zeke the zombie slayer versus the zombies from space, zeke slayed 140 zombies. in the sequel, zeke the zombie slayer versus the zombies from space, part 2, he slayed 5% more zombies. how many zombies were slain by zeke in the sequel?
Answers: 1
Mathematics, 21.06.2019 19:00
What is the explicit formula for this sequence? -7, -4, -1, 2, a.) an = 8 + (b - 1)3 b.) an = -7 + (n - 1)3 c.) an = 3 + (n -1) (-7) d.) an = -7 + (n - )
Answers: 1
Mathematics, 21.06.2019 22:00
Which of these triangle pairs can be mapped to each other using a single translation? cof hn
Answers: 2
You know the right answer?
. The dot plot shows the number of hours students spent last week on social networking sites. Which...
Questions
Mathematics, 25.06.2021 14:00

Chemistry, 25.06.2021 14:00


Business, 25.06.2021 14:00
Social Studies, 25.06.2021 14:00

English, 25.06.2021 14:00
Chemistry, 25.06.2021 14:00

Biology, 25.06.2021 14:00

Chemistry, 25.06.2021 14:00

Law, 25.06.2021 14:00
English, 25.06.2021 14:00
English, 25.06.2021 14:00


