Mathematics, 28.02.2021 20:20 juan01sebastian00
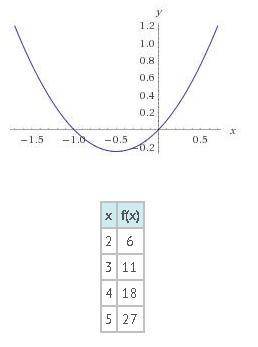
Compare the function represented by the table to the function represented by the graph to determine which statement is true.
A) The tabled function has a lower minimum value.
B) The tabled function has a greater maximum value.
C) The graphed function has a lower minimum value.
D) The graphed function has a greater maximum value.


Answers: 2


Another question on Mathematics

Mathematics, 21.06.2019 19:00
The fraction 7/9 is equivalent to a percent that is greater than 100%. truefalse
Answers: 1

Mathematics, 21.06.2019 19:30
Liz had 140 pens and inna had 100 pens. after inna gave liz some pens, liz had 3 times as many pens as inna. how many pens did inna give liz?
Answers: 2

Mathematics, 21.06.2019 20:40
Reduce fractions expressing probability to lowest terms. in 3,000 repetitions of an experiment, a random event occurred in 500 cases. the expected probability of this event is?
Answers: 3

Mathematics, 21.06.2019 21:10
The equation |pl = 2 represents the total number of points that can be earned or lost during one turn of a game. which best describes how many points can be earned or lost during one turn? o o -2 2 oor 2 -2 or 2 o
Answers: 1
You know the right answer?
Compare the function represented by the table to the function represented by the graph to determine...
Questions


Business, 11.02.2020 02:47

History, 11.02.2020 02:47


Mathematics, 11.02.2020 02:47


Mathematics, 11.02.2020 02:48

Mathematics, 11.02.2020 02:48


Social Studies, 11.02.2020 02:48


Computers and Technology, 11.02.2020 02:48


