
Mathematics, 01.03.2021 18:00 kortlen4808
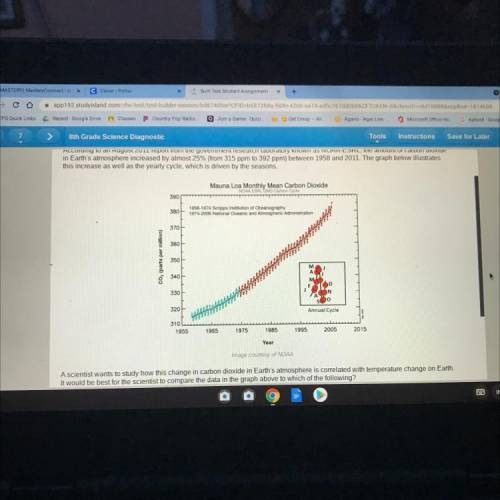
A scientist wants to study how this change in carbon dioxide in Earth's atmosphere is correlated with temperature change on Earth.
It would be best for the scientist to compare the data in the graph above to which of the following?
OA. a table showing the average high and low temperatures in various cities in 1958
ОВ. a graph showing the annual average global temperatures for 1958 through 2011
OC a table showing the average high and low temperatures in various cities in 2011
OD a graph showing the annual low temperatures in one city for 1958 through 2011

Answers: 2


Another question on Mathematics
Mathematics, 21.06.2019 19:20
The suare root of 9x plus 7 plus the square rot of 2x equall to 7
Answers: 1
Mathematics, 21.06.2019 19:30
Asurvey of 2,000 doctors showed that an average of 3 out of 5 doctors use brand x aspirin.how many doctors use brand x aspirin
Answers: 1
Mathematics, 21.06.2019 23:30
Which of the following exponential functions goes through the points (1, 6) and (2, 12)? f(x) = 3(2)x f(x) = 2(3)x f(x) = 3(2)−x f(x) = 2(3)−x
Answers: 1
You know the right answer?
A scientist wants to study how this change in carbon dioxide in Earth's atmosphere is correlated wit...
Questions
Mathematics, 19.10.2021 01:00
Mathematics, 19.10.2021 01:00


History, 19.10.2021 01:00

Mathematics, 19.10.2021 01:00


