Mathematics, 01.03.2021 21:00 glocurlsprinces
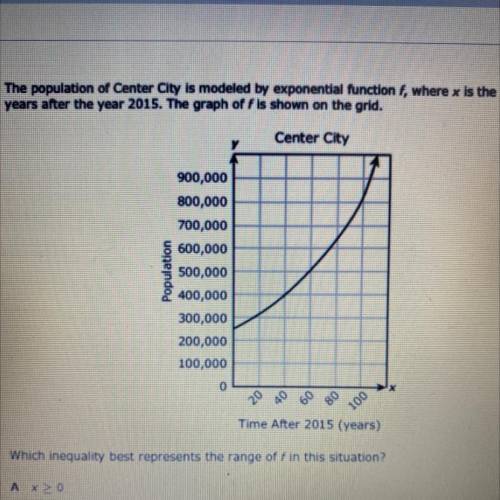
The population of Center City is models by exponential function f, where x is the number of year after the year 2015. The graph is f is shown on the grid. Which inequality best represents the range of f in this situation?


Answers: 1


Another question on Mathematics

Mathematics, 21.06.2019 21:30
Apool measures 100 meters by 100 meters a toddler inside the pool and trows a ball 60 centimeters from one edge of the pool.how far is the ball from the opposite edge of the pool
Answers: 1

Mathematics, 21.06.2019 22:00
In δabc, m∠acb = 90°, cd ⊥ ab and m∠acd = 45°. find: a find cd, if bc = 3 in
Answers: 1

Mathematics, 22.06.2019 01:20
The bottom of a slide at the playground is 6 feet from the base of the play set. the length of the slide is 10 feet. how tall is the slide. 11.66 feet 10 feet 6 feet 8 feet
Answers: 2

You know the right answer?
The population of Center City is models by exponential function f, where x is the number of year aft...
Questions

Computers and Technology, 27.03.2020 04:10


Physics, 27.03.2020 04:10


Computers and Technology, 27.03.2020 04:10


English, 27.03.2020 04:10

History, 27.03.2020 04:10

Biology, 27.03.2020 04:10


Biology, 27.03.2020 04:10

Physics, 27.03.2020 04:10


