
Mathematics, 02.03.2021 01:00 juliashalnev
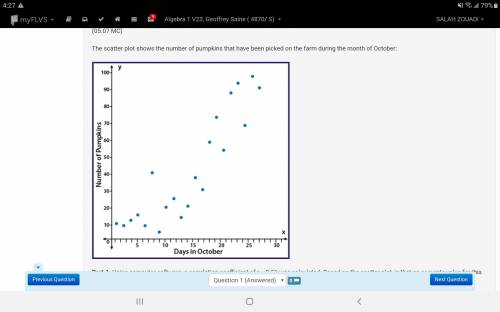
The scatter plot shows the number of pumpkins that have been picked on the farm during the month of October:
A scatter plot with points showing an upward trend with points that are moderately spread out from a line of best fit. The y axis is labeled Number of Pumpkins and the x axis is labeled Days in October
Part A: Using computer software, a correlation coefficient of r = 0.51 was calculated. Based on the scatter plot, is that an accurate value for this data? Why or why not? (5 points)
Part B: Instead of comparing the number of pumpkins picked and the day in October, write a scenario that would be a causal relationship for pumpkins picked on the farm. (5 points)

Answers: 3


Another question on Mathematics
Mathematics, 21.06.2019 18:30
Write an algebraic expression to match each statement a. four less than 8 times a number b. twice the difference of a number and six c. nine from a number squared
Answers: 1
Mathematics, 21.06.2019 20:30
Kyle and elijah are planning a road trip to california. their car travels 3/4 of a mile per min. if they did not stop driving, how many miles could kyle and elijah drove in a whole day? ? 1 day = 24 hours. plzzz write a proportion i will give you 100 points
Answers: 1
Mathematics, 21.06.2019 21:30
Handsome jack is buying a pony made of diamonds. the price of the pony is p dollars, and jack also has to pay a 25% diamond pony tax. which of the following expressions could represent how much jack pays in total for the pony?
Answers: 1
Mathematics, 21.06.2019 23:30
Solve this 364x-64x=300x and 12(x2–x–1)+13(x2–x–1)=25(x2–x–1)
Answers: 1
You know the right answer?
The scatter plot shows the number of pumpkins that have been picked on the farm during the month of...
Questions
Mathematics, 12.07.2019 09:30

Biology, 12.07.2019 09:30

Social Studies, 12.07.2019 09:30

Biology, 12.07.2019 09:30


History, 12.07.2019 09:30
Mathematics, 12.07.2019 09:30
Social Studies, 12.07.2019 09:30
Mathematics, 12.07.2019 09:30
Mathematics, 12.07.2019 09:30


