
Mathematics, 02.03.2021 14:00 edmundg2238
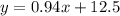
An employee compiled sales data for a company once each month. The scatter plot shows the sales for the company over time. The equation represents the linear model for this data. y = 0.94x + 12.5 According to the model, what were the company's sales when the employee began collecting data? $5000 $12,500 $20,000 $35,000 $45,000 A graph measuring sales in relation to time. A line indicates that sales increase as time increases

Answers: 2


Another question on Mathematics
Mathematics, 21.06.2019 23:00
Solve for x: 5/3 x = 20/21 it's fraction. remember to simplify your fraction
Answers: 2
Mathematics, 22.06.2019 01:00
Sanderson is having trouble with his assignment. his shown work is as follows: − 3 7 7 3 = − 3 7 × 7 3 = − 21 21 = −1 however, his answer does not match the answer that his teacher gives him. complete the description of sanderson's mistake. find the correct answer.
Answers: 3
Mathematics, 22.06.2019 02:00
Need to finish my juan wants to build a greenhouse in his back yard. he needs to maximize the ratio of floor area to structure volume in order to provide the most room for plants while minimizing the area to be heated. find the description of the structure that best meets juan’s criteria. a.) a hemisphere with a diameter of 12 feet b.) a cube with a side length of 12 feet c.) a cone with a diameter of 12 feet and a height of 10 feet d.) a square pyramid with a base side length of 12 feet and a height of 9 feet
Answers: 1
Mathematics, 22.06.2019 04:30
The survey of study habits and attitudes (ssha) is a psychological test that measures the motivation, attitude toward school, and study habits of students, scores range from 0 to 200. the mean score for u.s. college students is about 115, and the standard deviation is about 30. a teacher who suspects that older students have better attitudes toward school gives the ssha to 55 students who are at least 30 years of age. the mean score is 113.2. assume the population standard deviation is 30 for older students what is the margin of error for a 95% confidence interval for the population mean score for a. older students? b. compute the 95% confidence interval for the population mean score for older students. c. compute the 99% confidence interval for the population mean score for older students. d. compute the 88% confidence interval for the population mean score for older students.
Answers: 3
You know the right answer?
An employee compiled sales data for a company once each month. The scatter plot shows the sales for...
Questions

Social Studies, 19.07.2021 17:20
Mathematics, 19.07.2021 17:20
Mathematics, 19.07.2021 17:20

Mathematics, 19.07.2021 17:20

Mathematics, 19.07.2021 17:20
Mathematics, 19.07.2021 17:20

Biology, 19.07.2021 17:20

Mathematics, 19.07.2021 17:20


