PLEASE HELP TESTT 9. The graph of an exponential function is shown on the grid.
y
400
2...

Mathematics, 02.03.2021 17:10 jholland03
PLEASE HELP TESTT 9. The graph of an exponential function is shown on the grid.
y
400
200
-200
400
-600
-800|
1,000
- 1,200
1,400
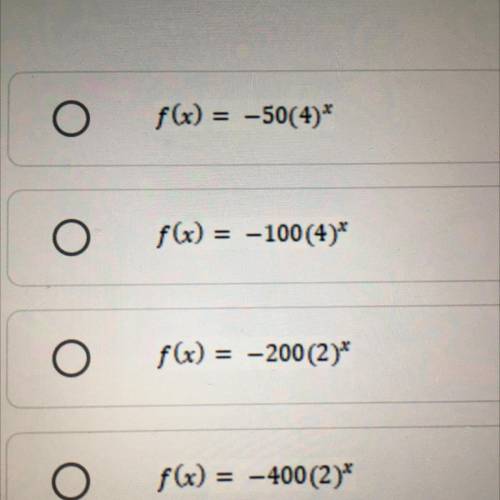
Which function is best represented by the graph?

Answers: 2


Another question on Mathematics
Mathematics, 21.06.2019 21:00
What number line represents the solution set for the inequality -1/2 greater than or equal to 4
Answers: 1
Mathematics, 21.06.2019 23:30
Mason and christian go to the movie theater and purchase refreshments for their friends. mason spends a total of $45.75 on 3 bags of popcorn and 6 drinks. christian spends a total of $71.50 on 6 bags of popcorn and 4 drinks. write a system of equations that can be used to find the price of one bag of popcorn and the price of one drink. using these equations, determine and state the price of a drink, to the nearest cent.
Answers: 2
Mathematics, 21.06.2019 23:40
Me d is also an option but i couldn't get it in the picture
Answers: 2
You know the right answer?
Questions
Mathematics, 17.09.2021 14:00

Social Studies, 17.09.2021 14:00


Medicine, 17.09.2021 14:00

Computers and Technology, 17.09.2021 14:00
Mathematics, 17.09.2021 14:00

Biology, 17.09.2021 14:00
English, 17.09.2021 14:00

Spanish, 17.09.2021 14:00

Chemistry, 17.09.2021 14:00
Computers and Technology, 17.09.2021 14:00

Mathematics, 17.09.2021 14:00


