
Mathematics, 02.03.2021 19:50 mmunozgo9334
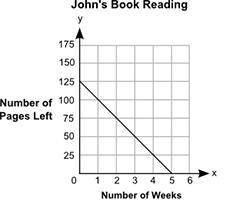
John reads an equal number of pages of a book every week. The graph below shows the number of pages of the book left to read, y, after x weeks:
A graph titled John’s Book Reading shows Number of Weeks on the x-axis and Number of Pages Left on the y-axis. The scale on the x-axis shows numbers from 0 to 6 at increments of 1, and the scale on the y-axis shows numbers from 0 to 175 at increments of 25. A straight line joins the ordered pairs 0, 125 and 1, 100 and 2, 75 and 3, 50 and 4, 25 and 5, 0.
HELP ME PLS
Which equation best models the relationship between x and y?
y = −5x + 25
y = −25x + 125
y = −25x + 175
y = −5x + 125

Answers: 2


Another question on Mathematics
Mathematics, 21.06.2019 18:00
Describe the relationship between the angles of similar triangles and the sides of similar triangles
Answers: 1
Mathematics, 21.06.2019 23:30
Atown has a population of 17000 and grows at 2.5% every year. to the nearest year, how long will it be until the population will reach 19600?
Answers: 1
You know the right answer?
John reads an equal number of pages of a book every week. The graph below shows the number of pages...
Questions


English, 19.02.2021 06:30

History, 19.02.2021 06:30
Mathematics, 19.02.2021 06:30

Biology, 19.02.2021 06:30

Mathematics, 19.02.2021 06:30


