
Mathematics, 02.03.2021 22:30 handog12
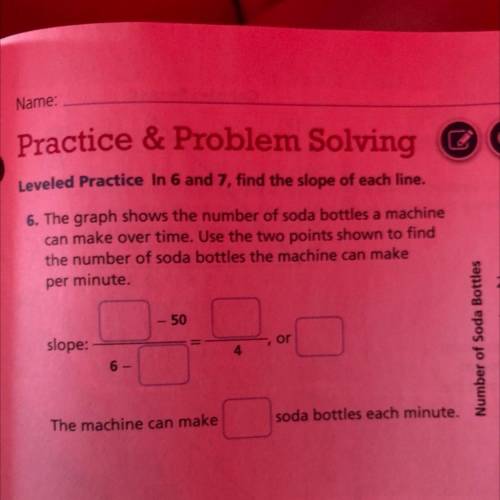
6. The graph shows the number of soda bottles a machine can make over time. Use the two points (2, 50) (6, 150) shown to find the number of soda bottles the machine can make
per minute.


Answers: 3


Another question on Mathematics
Mathematics, 21.06.2019 13:30
Geometry answer picture question pls . reason and statements
Answers: 3
Mathematics, 21.06.2019 17:30
Is appreciated! graph the functions and approximate an x-value in which the exponential function surpasses the polynomial function. f(x) = 4^xg(x) = 4x^2options: x = -1x = 0x = 1x = 2
Answers: 1
Mathematics, 21.06.2019 19:00
Since opening night, attendance at play a has increased steadily, while attendance at play b first rose and then fell. equations modeling the daily attendance y at each play are shown below, where x is the number of days since opening night. on what day(s) was the attendance the same at both plays? what was the attendance? play a: y = 8x + 191 play b: y = -x^2 + 26x + 126 a. the attendance was never the same at both plays. b. the attendance was the same on day 5. the attendance was 231 at both plays on that day. c. the attendance was the same on day 13. the attendance was 295 at both plays on that day. d. the attendance was the same on days 5 and 13. the attendance at both plays on those days was 231 and 295 respectively.
Answers: 1
You know the right answer?
6. The graph shows the number of soda bottles a machine can make over time. Use the two points (2, 5...
Questions


French, 21.07.2019 16:30

History, 21.07.2019 16:30

Mathematics, 21.07.2019 16:30
Geography, 21.07.2019 16:30
Mathematics, 21.07.2019 16:30


Social Studies, 21.07.2019 16:30
Mathematics, 21.07.2019 16:30
Mathematics, 21.07.2019 16:30


