The population of a City
The graph shows the population of a city from 1900 to 2000.
1....

Mathematics, 02.03.2021 22:50 jagslovegirl
The population of a City
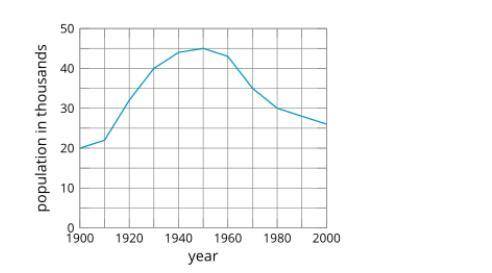
The graph shows the population of a city from 1900 to 2000.
1.What is the average rate of change of the population between 1930 and 1950? Show your reasoning.
2. For each interval, decide if the average rate of change is positive or negative.
a. from 1930 to 1940
b. from 1950 to 1970
c. from 1930 to 1970
3. In which decade (10-year interval) did the population grow the fastest? Explain how you know.
help!

Answers: 3


Another question on Mathematics
Mathematics, 21.06.2019 15:30
What is the length of the missing leg in this right triangle? 18 mm 24 mm 26 mm 32 mm
Answers: 1
Mathematics, 21.06.2019 22:30
In a certain city, the hourly wage of workers on temporary employment contracts is normally distributed. the mean is $15 and the standard deviation is $3. what percentage of temporary workers earn less than $12 per hour? a. 6% b. 16% c. 26% d. 36%
Answers: 1
Mathematics, 22.06.2019 01:00
What is the value of the discriminant, b2 ? 4ac, for the quadratic equation 0 = x2 ? 4x + 5, and what does it mean about the number of real solutions the equation has?
Answers: 3
You know the right answer?
Questions

Mathematics, 26.07.2019 07:30

Mathematics, 26.07.2019 07:30


Biology, 26.07.2019 07:30

Biology, 26.07.2019 07:30

Health, 26.07.2019 07:30


