
Mathematics, 03.03.2021 01:10 miya214
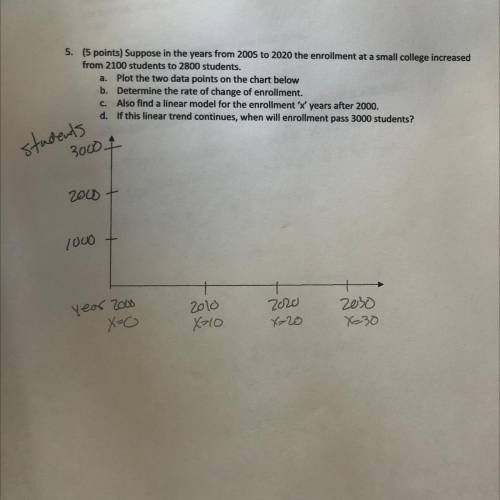
Suppose in the years from 2005 to 2020 enrollment at a small college increased from 2100 students to 2800 students a. Plot the two data points on the chart below b. Determine the rate of change of enrollment c. Also find the linear model for the enrollment X years after 2000 d. If this linear trend continues when will enrollment past 3000 students?

Answers: 1


Another question on Mathematics
Mathematics, 21.06.2019 14:50
On a piece of paper, graph . then determine which answer choice matches the graph you drew
Answers: 1
Mathematics, 21.06.2019 15:00
Ateacher has $80 to buy workbooks. each work book cost $3. if she buys as many workbooks as possible, how much money does she have leftover? a) $2 b) $4 c) $6 d) $8
Answers: 1
Mathematics, 21.06.2019 17:30
What values of x satisfy the inequality x^2-9x< 0? how is your answer shown on the graph?
Answers: 2
Mathematics, 21.06.2019 19:50
Raj encoded a secret phrase using matrix multiplication. using a = 1, b = 2, c = 3, and so on, he multiplied the clear text code for each letter by the matrix to get a matrix that represents the encoded text. the matrix representing the encoded text is . what is the secret phrase? determine the location of spaces after you decode the text. yummy is the corn the tomato is red the corn is yummy red is the tomato
Answers: 2
You know the right answer?
Suppose in the years from 2005 to 2020 enrollment at a small college increased from 2100 students to...
Questions


Computers and Technology, 02.11.2020 01:40
Mathematics, 02.11.2020 01:40

Biology, 02.11.2020 01:40
Arts, 02.11.2020 01:40

Chemistry, 02.11.2020 01:40


Mathematics, 02.11.2020 01:40
Mathematics, 02.11.2020 01:40
Mathematics, 02.11.2020 01:40
Computers and Technology, 02.11.2020 01:40


