
Mathematics, 26.08.2019 15:10 inucornspineapple
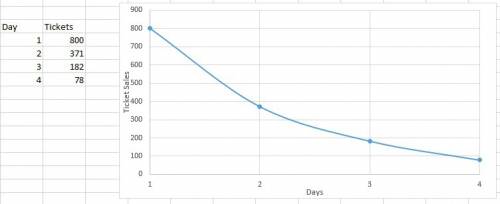
Aschool is keeping track of the number of tickets remaining for its year-end festival. the table shows the number of sales for the first, second, third, and fourth weeks of the month leading up to the festival. which graph could represent the data shown in the table?
day tickets 1 | 800 2 | 371 3 | 182 4 | 78 explain. i am not sure how to solve these. so much!

Answers: 2


Another question on Mathematics
Mathematics, 21.06.2019 15:00
Ricardo ran the 400 meter race 3 times his fastest time was 54.3 seconds his slowest time was 56.1 seconds if his average time was 55.0 seconds what was his time for the third race
Answers: 2
Mathematics, 21.06.2019 15:40
What is the first quartile of the data set? 10, 11, 12, 15, 17, 19, 22, 24, 29, 33, 38 a. 12 b. 19 c. 29 d. 10
Answers: 1
Mathematics, 21.06.2019 16:30
Which of the following answers is 7/9 simplified? 7/9 2/9 11/9 2/7
Answers: 2
Mathematics, 21.06.2019 20:20
Tomas used 3 1/3 cups of flour and now has 1 2/3cups left. which equation can he use to find f, the number of cups of flour he had to begin with? f+3 1/3=1 2/3 f-3 1/3=1 2/3 3 1/3f=1 2/3 f/3 1/3=1 2/3
Answers: 1
You know the right answer?
Aschool is keeping track of the number of tickets remaining for its year-end festival. the table sho...
Questions

History, 20.01.2021 20:00

Spanish, 20.01.2021 20:00

Arts, 20.01.2021 20:00

Mathematics, 20.01.2021 20:00
Arts, 20.01.2021 20:00
Mathematics, 20.01.2021 20:00
Mathematics, 20.01.2021 20:00
Mathematics, 20.01.2021 20:00
Mathematics, 20.01.2021 20:00
Mathematics, 20.01.2021 20:00
Mathematics, 20.01.2021 20:00
Mathematics, 20.01.2021 20:00

Mathematics, 20.01.2021 20:00


