
Mathematics, 03.03.2021 21:00 wallacelizzy1
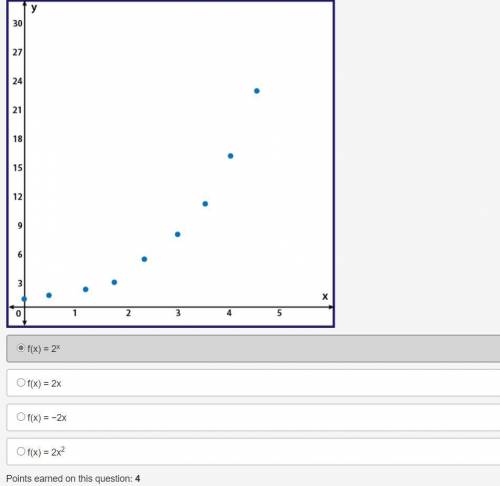
Given the scatter plot, choose the function that best fits the data.
scatter plot with data points that form an upward curve staring at the origin and continuing to the right
f(x) = 2x
f(x) = 2x
f(x) = −2x
f(x) = 2x2

Answers: 1


Another question on Mathematics
Mathematics, 21.06.2019 14:30
Aswimming pool has an input pump for filling the pool and an output pump for emptying the pool. the input pump can fill the pool in 3 hours, and the output pump can drain the pool in 5 hours. as you go to bed, the pool is full, but a neighbor’s kid turns on the output pump. at midnight, you awake to find the pool half empty. immediately, you turn on the input pump, but you are sleepy and forget to turn off the output pump. at what time will the pool become full?
Answers: 1
You know the right answer?
Given the scatter plot, choose the function that best fits the data.
scatter plot with data points...
Questions
Mathematics, 29.12.2019 08:31

English, 29.12.2019 08:31

History, 29.12.2019 08:31
Mathematics, 29.12.2019 08:31
Mathematics, 29.12.2019 08:31


Biology, 29.12.2019 08:31
Biology, 29.12.2019 08:31

Spanish, 29.12.2019 08:31

Biology, 29.12.2019 08:31

Physics, 29.12.2019 08:31


