
Mathematics, 04.03.2021 03:00 savjk74
Help please!
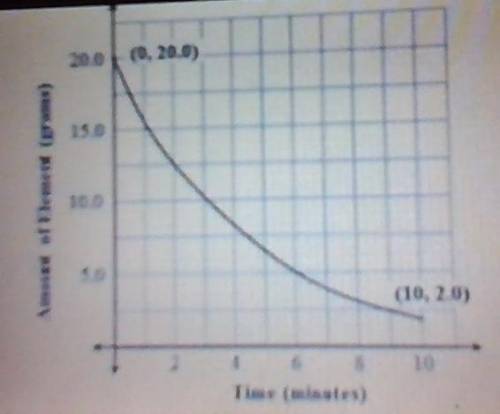
The graph models the amount of radioactive element present over the course of a 10-minute experiment.
What is the average rate of change of the amount of the element over the 10-minute experiment?
A.
-1.8 g/min
B.
-2.0 g/min
C.
-5.0 g/min
D.
-0.2 g/min

Answers: 3


Another question on Mathematics
Mathematics, 21.06.2019 13:30
Jayne is studying urban planning and finds that her town is decreasing in population by 3% each year the population of her town is changing by a constant rate
Answers: 2
Mathematics, 21.06.2019 15:30
What is the probability of drawing three queens from a standard deck of cards, given that the first card drawn was a queen? assume that the cards are not replaced.
Answers: 2
Mathematics, 21.06.2019 16:00
Select all the correct answers. what is 221,000,000,000,000,000,000 expressed in scientific notation?
Answers: 2
You know the right answer?
Help please!
The graph models the amount of radioactive element present over the course of a 10-min...
Questions


Biology, 12.11.2019 05:31
Mathematics, 12.11.2019 05:31
Mathematics, 12.11.2019 05:31
Mathematics, 12.11.2019 05:31


