
Mathematics, 04.03.2021 20:00 cammie5292
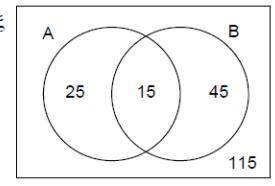
The Venn diagram shows the number of left-handed students (A) and vegetarians (B) in the same
year group.
(a) Write down P(A∩B) _
(b) How many students are in the year group? _
(c) A student is chosen at random. What is the probability that
they are a right-handed vegetarian?

Answers: 2


Another question on Mathematics
Mathematics, 21.06.2019 20:00
Someone answer asap for ! max recorded the heights of 500 male humans. he found that the heights were normally distributed around a mean of 177 centimeters. which statements about max’s data must be true? a. the median of max’s data is 250 b. more than half of the data points max recorded were 177 centimeters. c. a data point chosen at random is as likely to be above the mean as it is to be below the mean. d. every height within three standard deviations of the mean is equally likely to be chosen if a data point is selected at random.
Answers: 1
Mathematics, 21.06.2019 21:00
Ian is in training for a national hot dog eating contest on the 4th of july. on his first day of training, he eats 4 hot dogs. each day, he plans to eat 110% of the number of hot dogs he ate the previous day. write an explicit formula that could be used to find the number of hot dogs ian will eat on any particular day.
Answers: 3
You know the right answer?
The Venn diagram shows the number of left-handed students (A) and vegetarians (B) in the same
year...
Questions


Mathematics, 30.01.2020 23:44
Biology, 30.01.2020 23:44

Geography, 30.01.2020 23:44

Mathematics, 30.01.2020 23:44
Business, 30.01.2020 23:44
Mathematics, 30.01.2020 23:44


History, 30.01.2020 23:44
Mathematics, 30.01.2020 23:44


