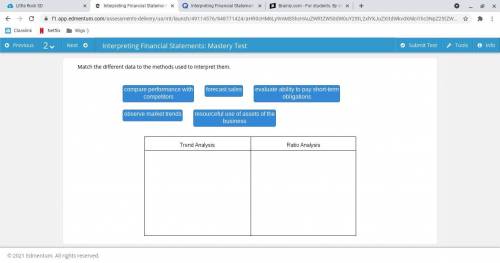
Match the different data to the methods used to interpret them.
...

Mathematics, 04.03.2021 22:50 logan867
Match the different data to the methods used to interpret them.

Answers: 2


Another question on Mathematics
Mathematics, 21.06.2019 15:10
Two lines that do not intersect are skew. always sometimes or never
Answers: 1
Mathematics, 21.06.2019 21:30
Aladder that is 20ft long is leaning against the side of a building. if the angle formed between the ladder and the ground is 75 degrees how far is the bottom of the from the base of the building?
Answers: 1
Mathematics, 22.06.2019 01:00
The weight of 46 new patients of a clinic from the year 2018 are recorded and listed below. construct a frequency distribution, using 7 classes. then, draw a histogram, a frequency polygon, and an ogive for the data, using the relative information from the frequency table for each of the graphs. describe the shape of the histogram. data set: 130 192 145 97 100 122 210 132 107 95 210 128 193 208 118 196 130 178 187 240 90 126 98 194 115 212 110 225 187 133 220 218 110 104 201 120 183 124 261 270 108 160 203 210 191 180 1) complete the frequency distribution table below (add as many rows as needed): - class limits - class boundaries - midpoint - frequency - cumulative frequency 2) histogram 3) frequency polygon 4) ogive
Answers: 1
You know the right answer?
Questions


Business, 07.11.2019 01:31


Computers and Technology, 07.11.2019 01:31


