
Mathematics, 05.03.2021 21:10 morrowdrew
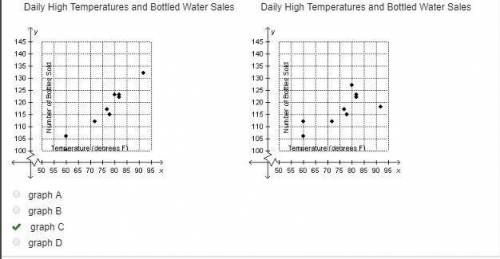
Which graph shows data that would allow the most accurate prediction for the number of water bottles a vendor sells based on the daily high temperature?
Graph A
Daily High Temperatures and Bottled Water Sales
On a graph, points are scattered all over the graph.
Graph B
Daily High Temperatures and Bottled Water Sales
On a graph, points are scattered all over the graph.
Graph C
Daily High Temperatures and Bottled Water Sales
On a graph, points are grouped together and form a line with positive slope.
Graph D
Daily High Temperatures and Bottled Water Sales
On a graph, points are grouped together and increase.
graph A
graph B
graph C
graph D

Answers: 2


Another question on Mathematics
Mathematics, 21.06.2019 18:00
Which statement about the relative areas of δabc and δxyz is true? the area of δabc > the area of δxyz the area of δabc < the area of δxyz the area of δabc = the area of δxyz more information is needed to compare.
Answers: 1
Mathematics, 21.06.2019 19:00
Zroms according to the synthetic division below, which of the following statements are true? check all that apply. 352 -2 6 -12 12 2 4 0 i a. (x-3) is a factor of 2x2 - 2x - 12. b. the number 3 is a root of f(x) = 2x2 - 2x - 12. c. (2x2 - 2x - 12) = (x + 3) = (2x + 4) d. (2x2 - 2x-12) - (x-3) = (2x + 4) e. (x+3) is a factor of 2x2 - 2x - 12. o f. the number -3 is a root of fx) = 2x2 - 2x - 12. previous
Answers: 2
Mathematics, 21.06.2019 20:40
In each of the cases that follow, the magnitude of a vector is given along with the counterclockwise angle it makes with the +x axis. use trigonometry to find the x and y components of the vector. also, sketch each vector approximately to scale to see if your calculated answers seem reasonable. (a) 50.0 n at 60.0°, (b) 75 m/ s at 5π/ 6 rad, (c) 254 lb at 325°, (d) 69 km at 1.1π rad.
Answers: 3
Mathematics, 21.06.2019 23:00
If 3 3/4 lb. of candy costs 20.25 how much would 1lb. of candy cost
Answers: 1
You know the right answer?
Which graph shows data that would allow the most accurate prediction for the number of water bottles...
Questions
Mathematics, 28.07.2019 06:00


Social Studies, 28.07.2019 06:00

History, 28.07.2019 06:00

Advanced Placement (AP), 28.07.2019 06:00

English, 28.07.2019 06:00
Biology, 28.07.2019 06:00


