The circle graph shows the
number of votes received by each candidate during a
school electio...

Mathematics, 05.03.2021 21:30 kevo2024
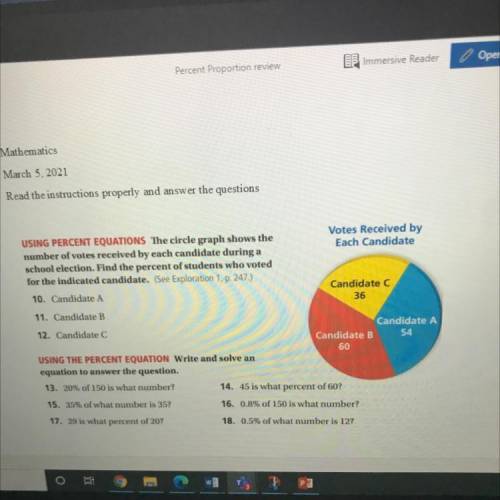
The circle graph shows the
number of votes received by each candidate during a
school election. Find the percent of students who voted
for the indicated candidate. (See Exploration 1, p. 247.)
10. Candidate A
11. Candidate B
12. Candidate C

Answers: 2


Another question on Mathematics
Mathematics, 21.06.2019 16:30
Which function is odd check all that apply a. y=sin x b. y=csc x c. y=cot x d. y=sec x
Answers: 1
Mathematics, 21.06.2019 22:00
Prove sin2a + cos2a - 1 / sin2a + cos2a + 1 = 1 - tana / 1 + cota
Answers: 2
Mathematics, 21.06.2019 23:30
What are the coordinates of the image of p for a dilation with center (0, 0) and scale factor 2
Answers: 1
You know the right answer?
Questions

Social Studies, 03.02.2020 20:05

Physics, 03.02.2020 20:05

Mathematics, 03.02.2020 20:05


Business, 03.02.2020 20:05

History, 03.02.2020 20:05
Physics, 03.02.2020 20:05


Computers and Technology, 03.02.2020 20:05
English, 03.02.2020 20:05
Mathematics, 03.02.2020 20:05


