
Mathematics, 06.03.2021 14:50 groovyghoulie5630
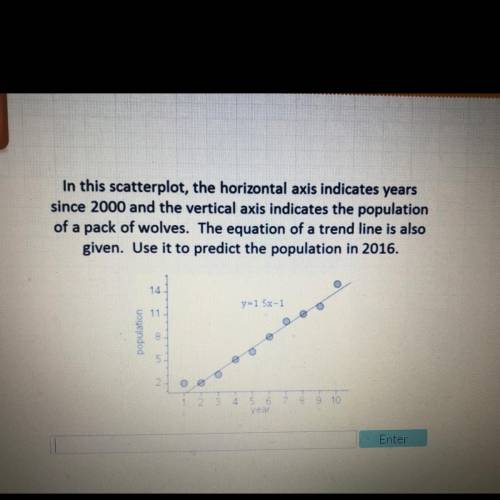
In this scatterplot, the horizontal axis indicates years
since 2000 and the vertical axis indicates the population
of a pack of wolves. The equation of a trend line is also
given. Use it to predict the population in 2016.
11

Answers: 3


Another question on Mathematics
Mathematics, 21.06.2019 13:00
Me what is the value of x? showing work would be appreciated - ! : )
Answers: 1
Mathematics, 21.06.2019 19:00
What is the expression in factored form? -x^2 + 3x + 28 a. (x-7)(x-4) b. -(x-7)(x+4) c. (x+4)(x+7) d. -(x-4)(x+7)
Answers: 2
Mathematics, 21.06.2019 19:00
Gh bisects fgi. find the measure of hgi •15° •21° •10° •8°
Answers: 2
Mathematics, 21.06.2019 20:00
Which type of graph would allow us to compare the median number of teeth for mammals and reptiles easily
Answers: 2
You know the right answer?
In this scatterplot, the horizontal axis indicates years
since 2000 and the vertical axis indicates...
Questions

History, 02.02.2020 17:02
Mathematics, 02.02.2020 17:02


Physics, 02.02.2020 17:02
Mathematics, 02.02.2020 17:02


Advanced Placement (AP), 02.02.2020 17:02

Biology, 02.02.2020 17:02

Mathematics, 02.02.2020 17:02


