Problem 3
The following graph represents a company’s cost, C, to produce (in blue) x
bottles...

Mathematics, 08.03.2021 02:10 daniel1480
Problem 3
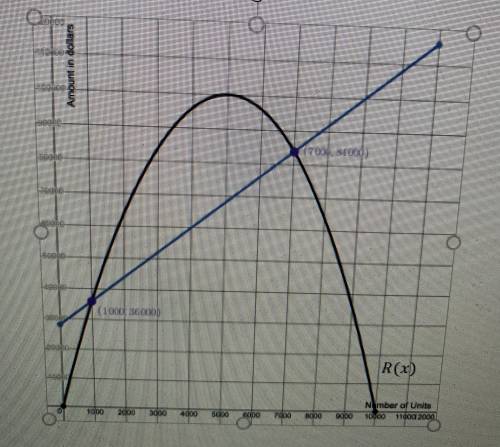
The following graph represents a company’s cost, C, to produce (in blue) x
bottles of household cleaning product. The graph also represents the same company’s revenue, R, (in black) for selling x bottles of household cleaning product.
Part a)
Use the graph to answer the following questions about
(R−C)(x):On what interval(s) is (R−C)(x) positive? What does this tell you in the context of the problem?
On what interval(s) is (R−C)(x) negative? What does this tell you in the context of the problem?
What are the x−intercept(s) of (R−C)(x)? What does this tell you in the context of the problem?

Answers: 1


Another question on Mathematics
Mathematics, 21.06.2019 15:30
Find the height of a square pyramid that has the volume of 32 ft.³ and a base lengthof 4 feet
Answers: 1
Mathematics, 21.06.2019 15:40
Use properties to rewrite the given equation. which equations have the same solution as 2.3p – 10.1 = 6.5p – 4 – 0.01p?
Answers: 2
Mathematics, 21.06.2019 18:00
The center of the circumscribed circle lies on line segment and the longest side of the triangle is equal to the of the circle.
Answers: 2
Mathematics, 21.06.2019 20:00
What is the ratio of the length of an object in yards to the length of the same object in miles?
Answers: 3
You know the right answer?
Questions


Biology, 27.01.2020 19:31
Biology, 27.01.2020 19:31
Biology, 27.01.2020 19:31

Computers and Technology, 27.01.2020 19:31

Social Studies, 27.01.2020 19:31
Mathematics, 27.01.2020 19:31
Mathematics, 27.01.2020 19:31
Mathematics, 27.01.2020 19:31


Mathematics, 27.01.2020 19:31


