
Mathematics, 08.03.2021 06:20 cmarton30140
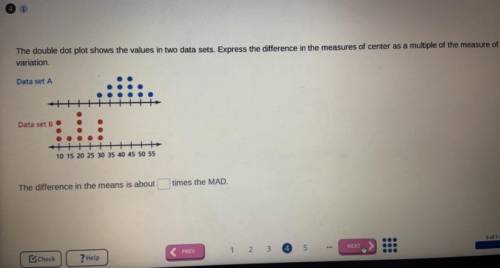
The double dot plot shows the values in two data sets. Express the difference in the measures of center as a multiple of the measure of
variation
Data set A
Data set B
..
10 15 20 25 30 35 40 45 50 55
The difference in the means is about
times the MAD

Answers: 1


Another question on Mathematics
Mathematics, 21.06.2019 23:30
The average daily maximum temperature for laura’s hometown can be modeled by the function f(x)=4.5sin(πx/6)+11.8 , where f(x) is the temperature in °c and x is the month. x = 0 corresponds to january.what is the average daily maximum temperature in may? round to the nearest tenth of a degree if needed.use 3.14 for π .
Answers: 1
Mathematics, 22.06.2019 00:00
Layla answer 21 of the 25 questions on his history test correctly.what decimal represents the fraction of problem he answer incorrectly.
Answers: 1
Mathematics, 22.06.2019 03:20
The table shows the height in feet of several students in miss patel’s class
Answers: 1
Mathematics, 22.06.2019 04:00
Scenario: 2 storage sheds are to have the same area. 1 is square and the other is rectangular. the rectangular shed is 4 meters wide and 9 meters long question: how large is one side of the square shed in meters?
Answers: 2
You know the right answer?
The double dot plot shows the values in two data sets. Express the difference in the measures of cen...
Questions


English, 10.05.2021 22:30
Mathematics, 10.05.2021 22:30


Spanish, 10.05.2021 22:30

History, 10.05.2021 22:40
Mathematics, 10.05.2021 22:40
Mathematics, 10.05.2021 22:40


