
Mathematics, 08.03.2021 14:40 tiff3692
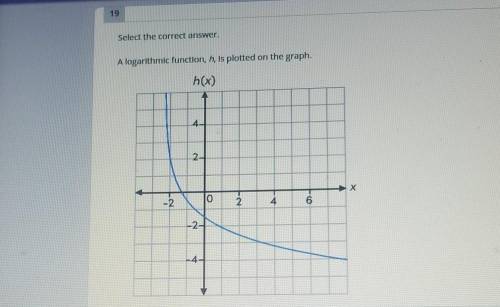
Look at the graph attached to this
What is the approximate rate of change of this function on the interval [-2,2]?
A. 4
B. −9/8
C. 8/7
D. -7/2
(Please explain your answer)

Answers: 3


Another question on Mathematics
Mathematics, 21.06.2019 15:30
Will used 20 colored tiles to make a design in art class. 5/20 of his tiles were red. what is an equivalent fraction for the red tiles?
Answers: 1
Mathematics, 21.06.2019 17:00
Acylinder has volume 45π and radius 3. what is it’s height?
Answers: 2
Mathematics, 21.06.2019 18:50
Abag contains 4 red, 7 blue and 5 yellow marbles. event a is defined as drawing a yellow marble on the first draw and event b is defined as drawing a blue marble on the second draw. if two marbles are drawn from the bag, one after the other and not replaced, what is p(b|a) expressed in simplest form? a. 7/16 b. 7/15 c. 14/16 d. 14/15
Answers: 1
You know the right answer?
Look at the graph attached to this
What is the approximate rate of change of this function on the i...
Questions


Mathematics, 22.07.2021 19:30

English, 22.07.2021 19:30


