
Mathematics, 08.03.2021 20:00 akornegay2
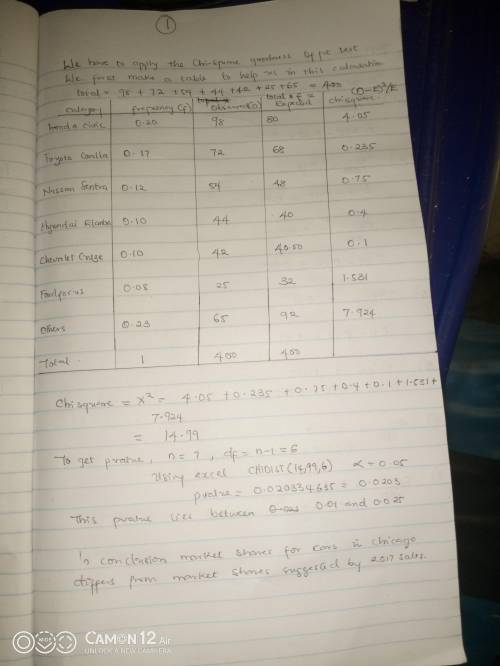
Based on 2017 sales, the six top-selling compact cars are the Honda Civic, Toyota Corolla, Nissan Sentra, Hyundai Elantra, Chevrolet Cruze, and Ford Focus (New York Daily News). The 2017 market shares are Honda Civic 20%, Toyota Corolla 17%, Nissan Sentra 12%, Hyundai Elantra 10%, Chevrolet Cruze 10%, and Ford Focus 8%, with other small car models comprising the remaining 23%. A sample of 400 compact car sales in Chicago showed the following number of vehicles sold.
Honda Civic 98
Toyota corolla 72
Nissan Sentra 54
Hyundai Elantra 44
Chevrolet Cruze 42
Ford Focus 25
Others 65
Use a goodness of fit test to determine whether the sample data indicate that the market shares for cars in Chicago are different than the market shares suggested by nationwide 2017 sales. Using a 0.05 level of significance, what is the p-value?
The p-value is.
What is your conclusion?
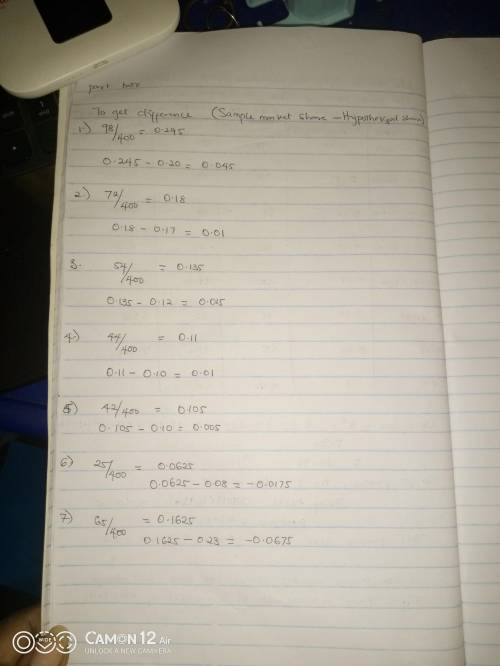
Conclude that the markets shares for the five compact cars in Chicago the market shares reported. What market share differences, if any, exist in Chicago? Round your answers to three decimal places.

Answers: 1


Another question on Mathematics
Mathematics, 21.06.2019 17:00
You have a 32-foot fence around a square garden. there are 4 equal sections. you paint 13 of one section of the fence. what fraction of the fence did you paint? you have a 32-foot fence around a square garden. there are 4 equal sections. you paint 13 of one section of the fence. what fraction of the fence did you paint?
Answers: 2
Mathematics, 22.06.2019 02:00
1. the manager of collins import autos believes the number of cars sold in a day (q) depends on two factors: (1) the number of hours the dealership is open (h) and (2) the number of salespersons working that day (s). after collecting data for two months (53 days), the manager estimates the following log-linear model: q 4 equation 1 a. explain, how to transform the log-linear model into linear form that can be estimated using multiple regression analysis. the computer output for the multiple regression analysis is shown below: q4 table b. how do you interpret coefficients b and c? if the dealership increases the number of salespersons by 20%, what will be the percentage increase in daily sales? c. test the overall model for statistical significance at the 5% significance level. d. what percent of the total variation in daily auto sales is explained by this equation? what could you suggest to increase this percentage? e. test the intercept for statistical significance at the 5% level of significance. if h and s both equal 0, are sales expected to be 0? explain why or why not? f. test the estimated coefficient b for statistical significance. if the dealership decreases its hours of operation by 10%, what is the expected impact on daily sales?
Answers: 2
Mathematics, 22.06.2019 06:10
Brainliest! write a verbal expression to represent the given equation. 4n-3=21
Answers: 2
You know the right answer?
Based on 2017 sales, the six top-selling compact cars are the Honda Civic, Toyota Corolla, Nissan Se...
Questions
Mathematics, 04.11.2019 23:31

English, 04.11.2019 23:31


English, 04.11.2019 23:31
History, 04.11.2019 23:31


