This graph shows the distance of a car from home as a
function of time.
Tell a story about th...

Mathematics, 08.03.2021 22:10 yo2lo15
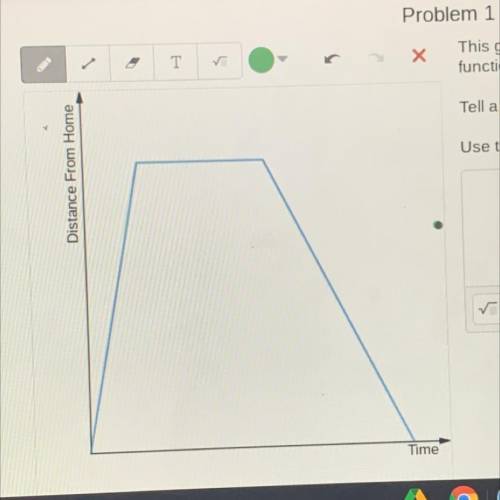
This graph shows the distance of a car from home as a
function of time.
Tell a story about the car's journey.
Use the sketch tool if it helps you to show your thinking.
HELP!

Answers: 2


Another question on Mathematics
Mathematics, 21.06.2019 17:30
If you apply the below transformations to the square root parent function, f(x) = vx, what is the equation of the new function? • shift 12 units right. • shift seven units down.
Answers: 1
Mathematics, 21.06.2019 20:00
Someone answer asap for ! a discount store’s prices are 25% lower than department store prices. the function c(x) = 0.75x can be used to determine the cost c, in dollars, of an item, where x is the department store price, in dollars. if the item has not sold in one month, the discount store takes an additional 20% off the discounted price and an additional $5 off the total purchase. the function d(y) = 0.80y - 5 can be used to find d, the cost, in dollars, of an item that has not been sold for a month, where y is the discount store price, in dollars. create a function d(c(x)) that represents the final price of an item when a costumer buys an item that has been in the discount store for a month. d(c(x)) =
Answers: 1
Mathematics, 21.06.2019 20:30
3.17 scores on stats final. below are final exam scores of 20 introductory statistics students. 1 2 3 4 5 6 7 8 9 10 11 12 13 14 15 16 17 18 19 20 57, 66, 69, 71, 72, 73, 74, 77, 78, 78, 79, 79, 81, 81, 82, 83, 83, 88, 89, 94 (a) the mean score is 77.7 points. with a standard deviation of 8.44 points. use this information to determine if the scores approximately follow the 68-95-99.7% rule. (b) do these data appear to follow a normal distribution? explain your reasoning using the graphs provided below.
Answers: 1
Mathematics, 21.06.2019 20:30
A. plot the data for the functions f(x) and g(x) on a grid and connect the points. x -2 -1 0 1 2 f(x) 1/9 1/3 1 3 9 x -2 -1 0 1 2 g(x) -4 -2 0 2 4 b. which function could be described as exponential and which as linear? explain. c. if the functions continue with the same pattern, will the function values ever be equal? if so, give estimates for the value of x that will make the function values equals. if not, explain why the function values will never be equal.
Answers: 3
You know the right answer?
Questions


Mathematics, 05.08.2020 04:01
Mathematics, 05.08.2020 04:01
Geography, 05.08.2020 04:01
Mathematics, 05.08.2020 04:01

Mathematics, 05.08.2020 04:01

Mathematics, 05.08.2020 04:01

Computers and Technology, 05.08.2020 04:01


Chemistry, 05.08.2020 04:01


