The amount of water in Tank A as it fills up is
represented by the graph.
By how much does th...

Mathematics, 08.03.2021 22:20 bks53
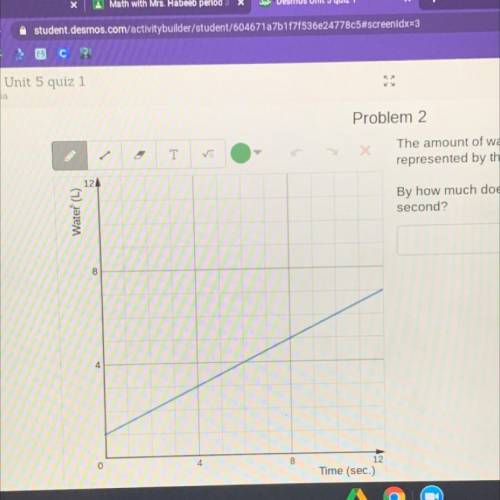
The amount of water in Tank A as it fills up is
represented by the graph.
By how much does the amount of water increase every
second?
HELP

Answers: 1


Another question on Mathematics
Mathematics, 21.06.2019 17:30
Student price tickets to a movie are $1 and non student tickets are $2. 350 tickets are sold and the total amount made is $450. how many non student tickets were sold ? a) 100 b) 150 c) 200 d)250
Answers: 2
Mathematics, 21.06.2019 18:00
Describe the relationship between the angles of similar triangles and the sides of similar triangles
Answers: 1
Mathematics, 21.06.2019 22:00
Find the greatest common factor of the followig monomials 46g^2h and 34g^6h^6
Answers: 1
Mathematics, 21.06.2019 23:30
The scatterplot represents the total fee for hours renting a bike. the line of best fit for the data is y = 6.855x + 10.215. which table shows the correct residual values for the data set?
Answers: 1
You know the right answer?
Questions

Chemistry, 18.09.2019 10:30


Mathematics, 18.09.2019 10:30

Social Studies, 18.09.2019 10:30


Mathematics, 18.09.2019 10:30
Mathematics, 18.09.2019 10:30
Mathematics, 18.09.2019 10:30

World Languages, 18.09.2019 10:30
History, 18.09.2019 10:30


