
Mathematics, 08.03.2021 22:20 jose477
Please help i only need c:))
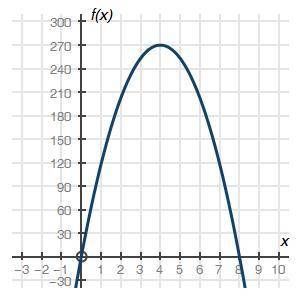
The graph below shows a company's profit f(x), in dollars, depending on the price of erasers x, in dollars, sold by the company:
Graph of quadratic function f of x having x intercepts at ordered pairs 0, 0 and 8, 0. The vertex is at 4, 270.
Part A: What do the x-intercepts and maximum value of the graph represent? What are the intervals where the function is increasing and decreasing, and what do they represent about the sale and profit? (4 points)
Part B: What is an approximate average rate of change of the graph from x = 1 to x = 4, and what does this rate represent? (3 points)
Part C: Describe the constraints of the domain. (3 points)

Answers: 1


Another question on Mathematics
Mathematics, 21.06.2019 18:00
In triangle △abc, ∠abc=90°, bh is an altitude. find the missing lengths. ah=4 and hc=1, find bh.
Answers: 1
Mathematics, 21.06.2019 21:00
Two cars which are 40 miles apart start moving simultaneously in the same direction with constant speeds. if the speed of the car which is behind is 56 mph and the speed of the other car is 48 mph, how many hours will it take for the car which is behind to catch up the car ahead of it?
Answers: 2
You know the right answer?
Please help i only need c:))
The graph below shows a company's profit f(x), in dollars, depending o...
Questions

History, 23.03.2021 19:30
Mathematics, 23.03.2021 19:30
Mathematics, 23.03.2021 19:30

English, 23.03.2021 19:30

Mathematics, 23.03.2021 19:30


Chemistry, 23.03.2021 19:30
Biology, 23.03.2021 19:30
Engineering, 23.03.2021 19:30
Mathematics, 23.03.2021 19:30


