
Mathematics, 08.03.2021 22:20 amalalghalib14
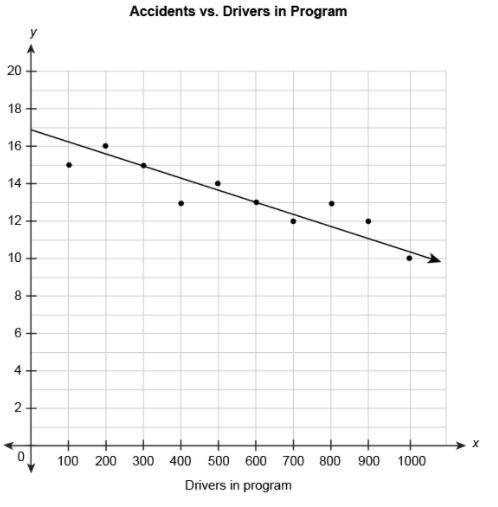
The scatter plot shows the relationship between the number of car accidents in a month and the number of drivers attending a program on distracted driving. The equation represents the linear model for this data.
y=−0.0067x+17
What does the number -0.0067 in the equation mean in this context?
The number of accidents was reduced by 0.67 per month for every additional 100 drivers in the program.
The number of accidents increased by 0.67 per month for every additional 100 drivers in the program.
The number of accidents was reduced by 0.67 per month for every additional driver in the program.
The number of accidents was reduced by 0.67 per month every month.
There were 0.67 accidents per month.
A graph measuring drivers in program in relation to accidents per month. A line indicates that accidents increase as drivers in program decreases.

Answers: 1


Another question on Mathematics
Mathematics, 21.06.2019 13:00
Marcus built a model car that is 4 inches wide. what scale was used to build the car if the actual width of the car is 6 feet? a. 1 in. = 2 ftb. 1 in. = 2.5 ftc. 1 in. = 1.5 ftd. 1 ft = 1.5 in.
Answers: 2
Mathematics, 21.06.2019 20:00
Evaluate the discriminant of each equation. tell how many solutions each equation has and whether the solutions are real or imaginary. 4x^2 + 20x + 25 = 0
Answers: 2
Mathematics, 21.06.2019 22:20
Question 9 of 10 2 points suppose your sat score is 1770. you look up the average sat scores for students admitted to your preferred colleges and find the list of scores below. based on your sat score of 1770, which average score below represents the college that would be your best option? o a. 1790 o b. 2130 o c. 2210 od. 1350
Answers: 3
Mathematics, 21.06.2019 22:30
Assume that y varies inversely with x. if y=1.6 when x=0.5 find x when y=3.2 acellus answer
Answers: 2
You know the right answer?
The scatter plot shows the relationship between the number of car accidents in a month and the numbe...
Questions


Mathematics, 17.06.2021 20:30

Business, 17.06.2021 20:30

Mathematics, 17.06.2021 20:30

English, 17.06.2021 20:30
Mathematics, 17.06.2021 20:30
Engineering, 17.06.2021 20:30
Mathematics, 17.06.2021 20:30
English, 17.06.2021 20:30
Mathematics, 17.06.2021 20:30
Mathematics, 17.06.2021 20:30


