
Mathematics, 09.03.2021 03:30 brennanjb00
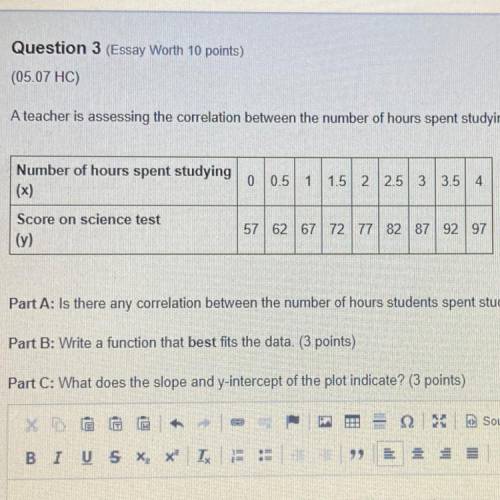
A teacher is assessing the correlation between the number of hours spent studying and the average score on a science test (will insert picture)
Part A: Is there any correlation between the number of hours students spent studying and the score on the science test? Justify your answer.
Part B: Write a function that best fits the data.
Part C: What does the slope and y-intercept of the plot indicate?

Answers: 1


Another question on Mathematics
Mathematics, 21.06.2019 20:30
Is the point (0, 8) on the x-axis or y-axis? how do you know?
Answers: 2
Mathematics, 21.06.2019 22:20
1. 2. ∠b and ∠y are right angles. 3.? 4.? which two statements are missing in steps 3 and 4? ∠x ≅ ∠c △abc ~ △zyx by the sas similarity theorem. ∠b ≅ ∠y △abc ~ △zyx by the sas similarity theorem. = 2 △abc ~ △zyx by the sss similarity theorem. = 2 △abc ~ △zyx by the sss similarity theorem.
Answers: 2
Mathematics, 22.06.2019 01:30
This graph shows a portion of an odd function. use the graph to complete the table of values. x f(x) −2 −3 −4 −6
Answers: 3
You know the right answer?
A teacher is assessing the correlation between the number of hours spent studying and the average sc...
Questions
Mathematics, 09.04.2020 19:29


Mathematics, 09.04.2020 19:29
Mathematics, 09.04.2020 19:29

Chemistry, 09.04.2020 19:29

Mathematics, 09.04.2020 19:29
Mathematics, 09.04.2020 19:29
Mathematics, 09.04.2020 19:29

Mathematics, 09.04.2020 19:29
Mathematics, 09.04.2020 19:29


