Actividad 4
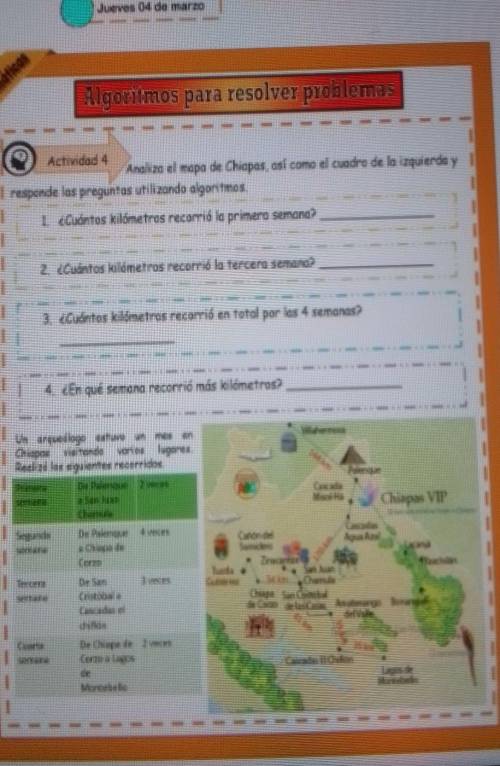
Analiza el mapa de Chiapas, así como el cuadro de la izquierda y !
responde las pr...

Mathematics, 09.03.2021 21:10 sslider
Actividad 4
Analiza el mapa de Chiapas, así como el cuadro de la izquierda y !
responde las preguntas utilizando algoritmos.
1. ¿Cuántos kilómetros recorrió la primera semana?
2. ¿Cuántos kilómetros recorrió la tercera semana?
3. ¿Cuántos kilómetros recorrió en total por las 4 semanas?
4. ¿En qué semana recorrió más kilómetros?
en
Villahermosa
Un arqueólogo estuvo un
Chiapas visitando
visitando varios lugares.
Realizó los siguientes recorridos
1
Primera De Palenque 2 veces
semana a San Juan
Chamula
Segunda De Palenque 4 veces
semana a Chiapa de
Corzo
Palenque
Cascada
Misol-Ha
Chiapas VIP
170 km
1
Cascadas
Grón del
Agua Azul
Sumidero
Lacanja
Zinacantan
Yaxchilan
Tuxtla-
San Juan
Gutiérrez 54 km Chamula
Chiapa San Cristobal
de Corzo de las Casas Amatenango Bonampak
del Valle
Tercera
3 veces
semana
De San
Cristóbal a
Cascadas el
chiflon
41 km
Cuarta
35 km
semana
De Chiapa de 2 veces
Corzo a Lagos
de
Cascadas El Chiflon


Answers: 2


Another question on Mathematics

Mathematics, 21.06.2019 22:30
I’m really confused and need your assist me with this question i’ve never been taught
Answers: 1

Mathematics, 22.06.2019 02:00
1. the manager of collins import autos believes the number of cars sold in a day (q) depends on two factors: (1) the number of hours the dealership is open (h) and (2) the number of salespersons working that day (s). after collecting data for two months (53 days), the manager estimates the following log-linear model: q 4 equation 1 a. explain, how to transform the log-linear model into linear form that can be estimated using multiple regression analysis. the computer output for the multiple regression analysis is shown below: q4 table b. how do you interpret coefficients b and c? if the dealership increases the number of salespersons by 20%, what will be the percentage increase in daily sales? c. test the overall model for statistical significance at the 5% significance level. d. what percent of the total variation in daily auto sales is explained by this equation? what could you suggest to increase this percentage? e. test the intercept for statistical significance at the 5% level of significance. if h and s both equal 0, are sales expected to be 0? explain why or why not? f. test the estimated coefficient b for statistical significance. if the dealership decreases its hours of operation by 10%, what is the expected impact on daily sales?
Answers: 2


Mathematics, 22.06.2019 02:30
Find the value of x to the nearest tenth. a. 4.5 b. 5.4 c. 6.3 d. 7.2
Answers: 1
You know the right answer?
Questions

Mathematics, 28.07.2019 09:00


Biology, 28.07.2019 09:00


Mathematics, 28.07.2019 09:00

Mathematics, 28.07.2019 09:00

Advanced Placement (AP), 28.07.2019 09:00


Mathematics, 28.07.2019 09:00

Biology, 28.07.2019 09:00


English, 28.07.2019 09:00

Chemistry, 28.07.2019 09:00


