
Mathematics, 09.03.2021 21:40 donbright100
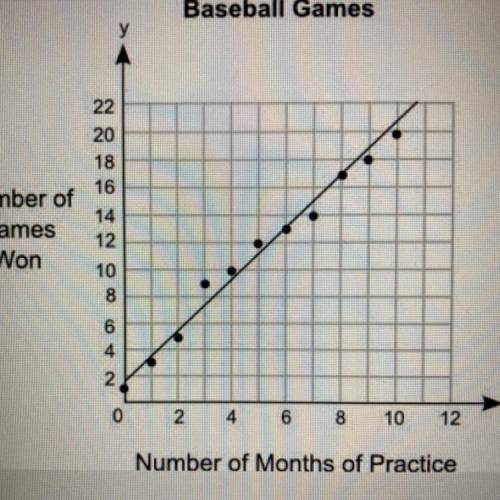
The graph shows the relationship between the number of months different students practiced baseball and the number of games they won:
Part A: What is the approximate y-intercept of the line of best fit and what does it represent? (5 points)
Part B: Write the equation for the line of best fit in slope-intercept form and use it to predict the number of games that could be won after 13 months of practice. Show your work and
include the points used to calculate the slope. (5 points)

Answers: 2


Another question on Mathematics
Mathematics, 21.06.2019 12:30
What is the range of this function? all real numbers such that y ≤ 40 all real numbers such that y ≥ 0 all real numbers such that 0 ≤ y ≤ 40 all real numbers such that 37.75 ≤ y ≤ 40
Answers: 3
Mathematics, 21.06.2019 19:00
To solve the system of equations below, pedro isolated the variable y in the first equation and then substituted it into the second equation. what was the resulting equation? { 5y=10x {x^2+y^2=36
Answers: 1
Mathematics, 21.06.2019 19:30
Koji is installing a rectangular window in an office building. the window is 823 feet wide and 534 feet high. the formula for the area of a rectangle is a=bh. what is the area of the window? enter your answer as a mixed number in simplest form in the box. $$ ft2
Answers: 1
Mathematics, 21.06.2019 20:30
What is 1/3x5 on anuber line what does it look like on a number line
Answers: 3
You know the right answer?
The graph shows the relationship between the number of months different students practiced baseball...
Questions


Geography, 11.07.2019 10:00

History, 11.07.2019 10:00

Mathematics, 11.07.2019 10:00

Mathematics, 11.07.2019 10:00
Mathematics, 11.07.2019 10:00
Mathematics, 11.07.2019 10:00
History, 11.07.2019 10:00
History, 11.07.2019 10:00
History, 11.07.2019 10:00
Mathematics, 11.07.2019 10:00
Geography, 11.07.2019 10:00
Geography, 11.07.2019 10:00


