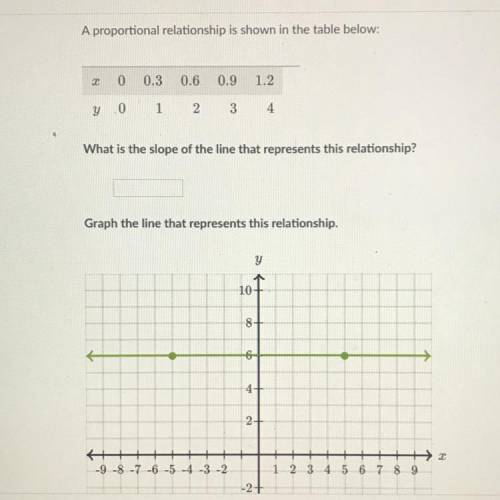
A proportional relationship is shown in the table below:
0
0.3
0.6
0.9
1.2<...

Mathematics, 10.03.2021 19:40 brettswain1342
A proportional relationship is shown in the table below:
0
0.3
0.6
0.9
1.2
y '0
1
2
3
4
What is the slope of the line that represents this relationship?
Graph the line that represents this relationship.

Answers: 2


Another question on Mathematics
Mathematics, 21.06.2019 21:00
What is the similarity ratio of a cube with volume 729m^3 to a cube with volume 3375 m^3
Answers: 2
Mathematics, 21.06.2019 21:30
50 plz, given the system of equations, match the following items. x + 3 y = 5 x - 3 y = -1 a) x-determinant b) y-determinant c) system determinant match the following to the pictures below.
Answers: 2
You know the right answer?
Questions

Mathematics, 29.01.2020 18:50

History, 29.01.2020 18:50

Social Studies, 29.01.2020 18:50

Chemistry, 29.01.2020 18:50

Mathematics, 29.01.2020 18:50
Social Studies, 29.01.2020 18:50
Chemistry, 29.01.2020 18:50
English, 29.01.2020 18:50
Mathematics, 29.01.2020 18:50
English, 29.01.2020 18:50


