
Mathematics, 11.03.2021 01:00 mistycascaden
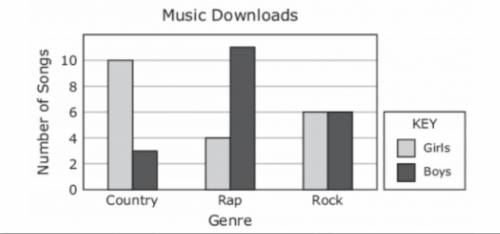
Parker conducted a random survey at the mall to determine the number of songs in each genre that were downloaded by 40 students. The results are shown in the bar graph.
Based on the information in the graph, which inference about the general population of students is valid?
A)
Girls like country music more than all other genres combined.
More girls than boys like rock music.
Boys like country music more than rock music.
Boys like rock music more than girls like rap music.

Answers: 3


Another question on Mathematics
Mathematics, 21.06.2019 15:30
Astore manager records the total visitors and sales, in dollars, for 10 days. the data is shown in the scatter plot. what conclusion can the store manager draw based on the data? question 3 options: an increase in sales causes a decrease in visitors. an increase in sales is correlated with a decrease in visitors. an increase in visitors is correlated with an increase in sales.
Answers: 1
Mathematics, 21.06.2019 19:30
Asurvey of 45 teens found that they spent an average of 25.6 hours per week in front of a screen (television, computer, tablet, phone, based on the survey’s sample mean, which value could be the population mean? 2.3 hours 27.4 hours 75.3 hours 41.5 hours
Answers: 1
Mathematics, 21.06.2019 21:00
M.xyz =radians. covert this radian measure to its equivalent measure in degrees.
Answers: 1
Mathematics, 21.06.2019 21:30
Look at triangle wxy what is the length (in centimeters) of the side wy of the triangle?
Answers: 2
You know the right answer?
Parker conducted a random survey at the mall to determine the number of songs in each genre that wer...
Questions
Mathematics, 16.07.2019 09:00
Mathematics, 16.07.2019 09:00
Mathematics, 16.07.2019 09:00

Biology, 16.07.2019 09:00

Mathematics, 16.07.2019 09:00


Chemistry, 16.07.2019 09:00


Chemistry, 16.07.2019 09:00


