
Mathematics, 11.03.2021 04:40 nathanstern21
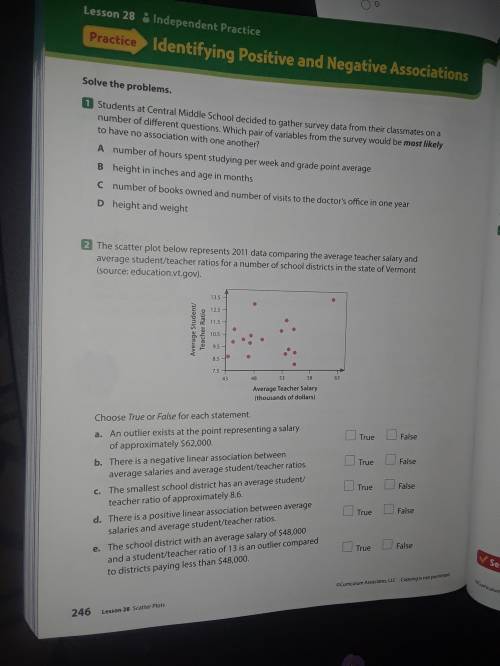
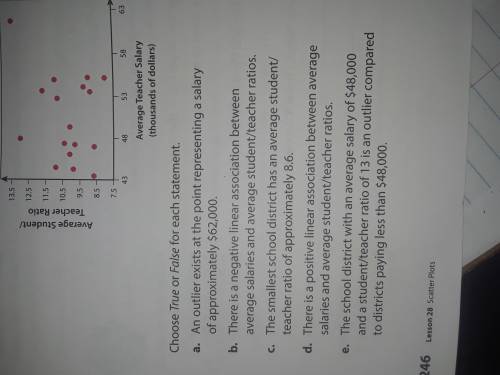
2.the scatter plot below represents 2011 data comparing the average teacher salary and average student/teacher ratios for a number of school districts in the state of Vermont
PLEASE DO NOT RESPONS IF YOU DON NOT THE ANSWER.
Choose TRUE OR FALSE for each letters from A THRU E.
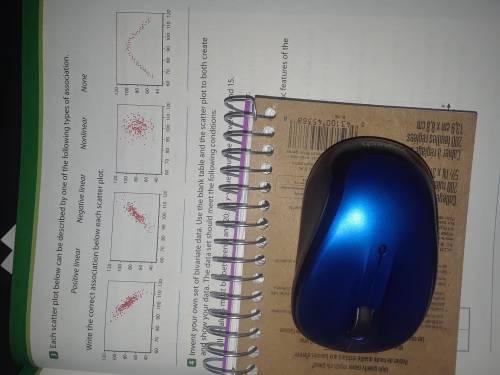
3.WRITE THE CORRECT ASSOCIATION BELOW EACH PLOT.{look at the image}#3
1,2,3,4 There are four image
PLEASE LOOK AT the last image there are more clear. REMEMBER DO NOT ANSWER IF YOU DO NOT HAVE THE CORRECT ANSWER please

Answers: 1


Another question on Mathematics
Mathematics, 21.06.2019 22:40
Alina fully simplifies this polynomial and then writes it in standard form. xy2 – 2x2y + 3y3 – 6x2y + 4xy2 if alina wrote the last term as 3y3, which must be the first term of her polynomial in standard form? xy2 5xy2 –8x2y –2x2y
Answers: 1
Mathematics, 21.06.2019 23:30
Darren earned $663.26 in net pay for working 38 hours. he paid $118.51 in federal and state income taxes, and $64.75 in fica taxes. what was darren's hourly wage? question options: $17.45 $19.16 $20.57 $22.28
Answers: 3
Mathematics, 22.06.2019 03:30
Right triangle abc has three sides with lengths ab= 119, bc = 169, ca= 120. find the value of cos c. hint: draw and label the triangle. the hypotenuse is always the longest.
Answers: 2
Mathematics, 22.06.2019 04:00
Abarge can safely haul no more than 400 tons across the river. the barge has an empty weight of 24 tons. the average weight of the railroad cars is 4 tons each.bhow many railroad cars can the barge haul?
Answers: 1
You know the right answer?
2.the scatter plot below represents 2011 data comparing the average teacher salary and average stude...
Questions


Biology, 17.02.2020 19:40


Mathematics, 17.02.2020 19:41


