
Mathematics, 11.03.2021 07:00 lovly8914
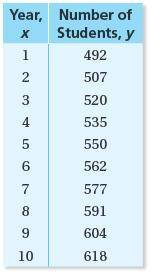
Use a graphing calculator to find an equation of the line of best fit for the data. Identify and interpret the correlation coefficient. Round the slope, the y-intercept, and the correlation coefficient to the nearest tenth.
Equation of the line of best fit: y=
Correlation coefficient: r≈

Answers: 2


Another question on Mathematics
Mathematics, 21.06.2019 21:20
The radius of the circle below intersects the unit circle at (3/5,4/5). what is the approximate value of theta? 0.6 radians 1.0 radians 36.9 degrees 53.1 degrees
Answers: 3
Mathematics, 21.06.2019 21:30
How do your peer relationships affect your overall health status? what can you do to improve your peer relationships?
Answers: 1
Mathematics, 21.06.2019 22:10
Atype of plant is introduced into an ecosystem and quickly begins to take over. a scientist counts the number of plants after mmonths and develops the equation p(m)= 19.3(1.089)^m to model the situation. most recently, the scientist counted 138 plants.assuming there are no limiting factors to the growth of the plants, about how many months have passed since the plants werefirst introduced? a)o 6.1b)0.6.6c)10 72d)o 23.1
Answers: 3
You know the right answer?
Use a graphing calculator to find an equation of the line of best fit for the data. Identify and int...
Questions

Chemistry, 15.04.2021 02:20

Computers and Technology, 15.04.2021 02:20

English, 15.04.2021 02:20


Social Studies, 15.04.2021 02:20

Arts, 15.04.2021 02:20
Mathematics, 15.04.2021 02:20

Mathematics, 15.04.2021 02:20
Physics, 15.04.2021 02:20


