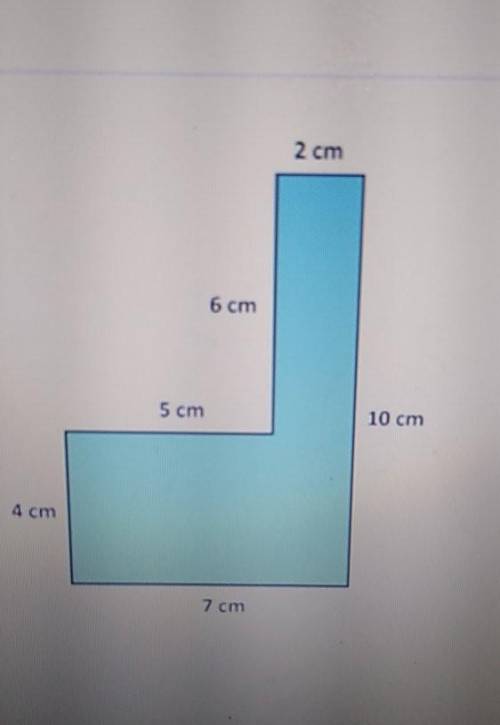
ANSWER ASAP PLZZZ. find the area of the composite figure
A.32cm
B.40cm
C.48cm
D.56cm...

Mathematics, 11.03.2021 18:40 rehel5106
ANSWER ASAP PLZZZ. find the area of the composite figure
A.32cm
B.40cm
C.48cm
D.56cm

Answers: 3


Another question on Mathematics
Mathematics, 21.06.2019 16:00
5× 1/2 = ? a) more than 5 because you are multiplying by a whole number b) 5/10 because you multiply the numerator and denominator by 5 c) less than 5 because you are multiplying by a number that is more than 1 d) less than 5 because you are multiplying by a number that is less than 1
Answers: 3
Mathematics, 21.06.2019 19:30
Solve the following inequalities and show the solution on a number line. 3/4 (2x-7) ≤ 5
Answers: 1
Mathematics, 22.06.2019 00:00
Titus works at a hotel. part of his job is to keep the complimentary pitcher of water at least half full and always with ice. when he starts his shift, the water level shows 4 gallons, or 128 cups of water. as the shift progresses, he records the level of the water every 10 minutes. after 2 hours, he uses a regression calculator to compute an equation for the decrease in water. his equation is w –0.414t + 129.549, where t is the number of minutes and w is the level of water. according to the equation, after about how many minutes would the water level be less than or equal to 64 cups?
Answers: 2
Mathematics, 22.06.2019 02:30
Atrain traveled for 1.5 hours to the first station, stopped for 30 minutes, then traveled for 4 hours to the final station where it stopped for 1 hour. the total distance traveled is a function of time. which graph most accurately represents this scenario? a graph is shown with the x-axis labeled time (in hours) and the y-axis labeled total distance (in miles). the line begins at the origin and moves upward for 1.5 hours. the line then continues upward at a slow rate until 2 hours. from 2 to 6 hours, the line continues quickly upward. from 6 to 7 hours, it moves downward until it touches the x-axis a graph is shown with the axis labeled time (in hours) and the y axis labeled total distance (in miles). a line is shown beginning at the origin. the line moves upward until 1.5 hours, then is a horizontal line until 2 hours. the line moves quickly upward again until 6 hours, and then is horizontal until 7 hours a graph is shown with the axis labeled time (in hours) and the y-axis labeled total distance (in miles). the line begins at the y-axis where y equals 125. it is horizontal until 1.5 hours, then moves downward until 2 hours where it touches the x-axis. the line moves upward until 6 hours and then moves downward until 7 hours where it touches the x-axis a graph is shown with the axis labeled time (in hours) and the y-axis labeled total distance (in miles). the line begins at y equals 125 and is horizontal for 1.5 hours. the line moves downward until 2 hours, then back up until 5.5 hours. the line is horizontal from 5.5 to 7 hours
Answers: 1
You know the right answer?
Questions
Mathematics, 21.05.2021 16:30

English, 21.05.2021 16:30
Mathematics, 21.05.2021 16:30

Mathematics, 21.05.2021 16:30
Mathematics, 21.05.2021 16:30
Mathematics, 21.05.2021 16:30
Mathematics, 21.05.2021 16:30


Advanced Placement (AP), 21.05.2021 16:30
English, 21.05.2021 16:30

Chemistry, 21.05.2021 16:30
Chemistry, 21.05.2021 16:30


