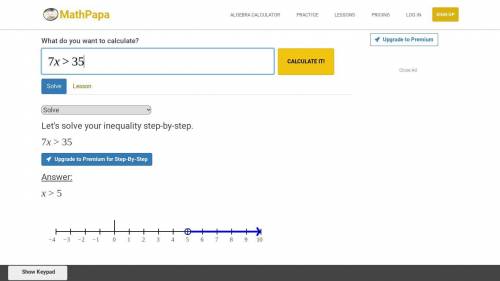
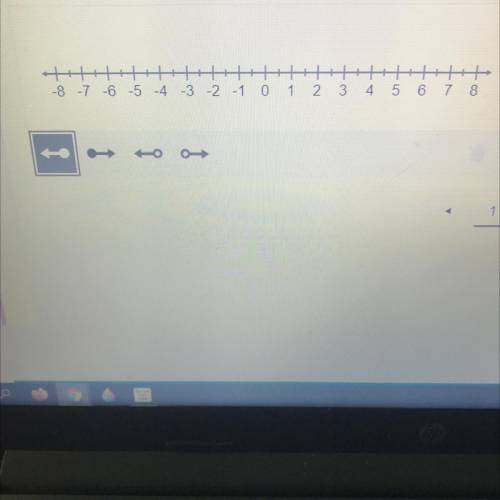
Graph the solution of this inequality on the number line.
7x > 35
...

Mathematics, 11.03.2021 20:50 alxiar19
Graph the solution of this inequality on the number line.
7x > 35

Answers: 2


Another question on Mathematics
Mathematics, 22.06.2019 01:00
What is the value of the discriminant, b2 ? 4ac, for the quadratic equation 0 = x2 ? 4x + 5, and what does it mean about the number of real solutions the equation has?
Answers: 3
Mathematics, 22.06.2019 03:30
Use a calculator to verify that σ(x) = 62, σ(x2) = 1034, σ(y) = 644, σ(y2) = 93,438, and σ(x y) = 9,622. compute r. (enter a number. round your answer to three decimal places.) as x increases from 3 to 22 months, does the value of r imply that y should tend to increase or decrease? explain your answer. given our value of r, y should tend to increase as x increases. given our value of r, we can not draw any conclusions for the behavior of y as x increases. given our value of r, y should tend to remain constant as x increases. given our value of r, y should tend to decrease as x increases.
Answers: 3
Mathematics, 22.06.2019 06:00
Victoria created the scatterplot below based on the data in the table for the ages and heights of some teachers in her school. she wants to see if a teachers heigh depends on his or her age. what did she do wrong when she created the scatterplot
Answers: 1
You know the right answer?
Questions
Mathematics, 28.09.2020 21:01


English, 28.09.2020 21:01
Mathematics, 28.09.2020 21:01
Mathematics, 28.09.2020 21:01

Mathematics, 28.09.2020 21:01
Mathematics, 28.09.2020 21:01
English, 28.09.2020 21:01
Mathematics, 28.09.2020 21:01

Social Studies, 28.09.2020 21:01

Chemistry, 28.09.2020 21:01
Mathematics, 28.09.2020 21:01


