
Mathematics, 11.03.2021 23:10 abalth2154
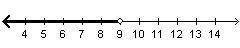
Plz Help Me Which inequality is represented by the graph below? Check all that apply.
A number line going from 4 to 14. An open circle is at 9. Everything to the left of the circle is shaded.
x greater-than 9
x less-than 9
any rational number greater than or including 9
any rational number less than or including 9
any rational number greater than 9
any rational number less than 9

Answers: 3


Another question on Mathematics
Mathematics, 21.06.2019 19:00
Astore has clearance items that have been marked down by 60%. they are having a sale, advertising an additional 55% off clearance items. what percent of the original price do you end up paying?
Answers: 1
Mathematics, 21.06.2019 19:30
When x = 3 and y = 5, by how much does the value of 3x2 – 2y exceed the value of 2x2 – 3y ?
Answers: 2
Mathematics, 21.06.2019 20:00
The distribution of the amount of money spent by students for textbooks in a semester is approximately normal in shape with a mean of $235 and a standard deviation of $20. according to the standard deviation rule, how much did almost all (99.7%) of the students spend on textbooks in a semester?
Answers: 2
You know the right answer?
Plz Help Me Which inequality is represented by the graph below? Check all that apply.
A number line...
Questions


Mathematics, 18.10.2021 01:50

Mathematics, 18.10.2021 01:50
English, 18.10.2021 01:50
Mathematics, 18.10.2021 01:50
Mathematics, 18.10.2021 01:50

Mathematics, 18.10.2021 01:50
Mathematics, 18.10.2021 01:50


