
Mathematics, 12.03.2021 14:00 kenaygardel
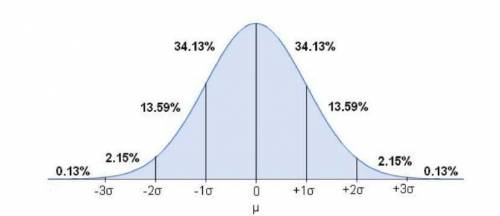
The following figure shows the normal distribution with the proportion of the area under the normal curve contained within one, two, and three standard deviations of the mean. The last proportion on each side, 0.13%, depicts the remaining area under the curve. Specifically, 0.13% of the area under the standard normal distribution is located above z-score values greater than the mean (μ) plus three standard deviations ( +3 ). Also, because the normal distribution is symmetrical, 0.13% of the area under the standard normal distribution is located below z-score values less than the mean (μ) minus three standard deviations (-3 ).
Use the figure to help you answer the following questions: (attached)
The National Assessment of Educational Progress (NAEP) is a nationwide assessment of students' proficiency in nine subjects: mathematics, reading, writing, science, the arts, civics, economics, geography, and U. S. history. The
main NAEP assessments are conducted annually on samples of students from grades 4, 8, and 12.
In 2000, the science scores for female students had a mean of 146 with a standard deviation of 35. Assume that these scores are normally distributed with the given mean and standard deviation.
A score of 41 is _ standard deviations below the mean, while a score
of 251 is _ standard deviations above the mean.
This means that the percentage of female students with scores between 41 and 251 is _ %.
A score of 181 is _ above the mean.
As a result, the percentage of female students with scores below 181 is _ %.
You can infer that 97.72% of the female students have scores above_.

Answers: 1


Another question on Mathematics
Mathematics, 21.06.2019 14:20
Answers; a) 135 degree’s b) 30 degree’s c) 180 or 0 degree’s d) 90 degree’s
Answers: 1
Mathematics, 21.06.2019 20:30
Asunflower was 20 1/2 inches tall. over the next 6 months, it grew to a height of 37 inches tall. what was the average yearly growth rate of the height of the plzzz write a proportion i will give you 100 points
Answers: 1
Mathematics, 21.06.2019 23:00
Acaterpillar eats 1400\%1400% of its birth mass in one day. the caterpillar's birth mass is mm grams. which of the following expressions could represent the amount, in grams, the caterpillar eats in one day? \
Answers: 1
You know the right answer?
The following figure shows the normal distribution with the proportion of the area under the normal...
Questions
Mathematics, 21.10.2020 03:01


Biology, 21.10.2020 03:01

Mathematics, 21.10.2020 03:01
Mathematics, 21.10.2020 03:01

Health, 21.10.2020 03:01
English, 21.10.2020 03:01
Mathematics, 21.10.2020 03:01


Social Studies, 21.10.2020 03:01

Chemistry, 21.10.2020 03:01
Mathematics, 21.10.2020 03:01


