
Mathematics, 13.03.2021 02:10 rjennis002
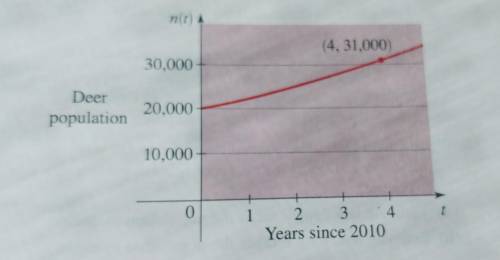
The graph shows the deer population in a Pennsylvania country between 2010 and 2014. Assume that the population grows exponentially.
a. What was the deer population in 2010?
b. Find a function that models the deer population t years after 2010.
c. What is the projected deer population in 2018?
d. Estimate how long it take the population to reach 100,000.

Answers: 2


Another question on Mathematics
Mathematics, 21.06.2019 18:00
The longer leg of a 30° 60° 90° triangle is 16 times square root of three how long is a shorter leg
Answers: 1
Mathematics, 21.06.2019 19:30
Explain how you can find the missing fraction in 3 4/5 / (blank) 2 5/7. then find the missing fraction.
Answers: 2
Mathematics, 21.06.2019 20:30
Find the nonpermissible replacement for binthis expression.b2/5b +5
Answers: 1
You know the right answer?
The graph shows the deer population in a Pennsylvania country between 2010 and 2014. Assume that the...
Questions

Mathematics, 09.12.2021 04:40

Business, 09.12.2021 04:40

Computers and Technology, 09.12.2021 04:40


Chemistry, 09.12.2021 04:40


Mathematics, 09.12.2021 04:40


