
Mathematics, 17.03.2021 23:50 didirose
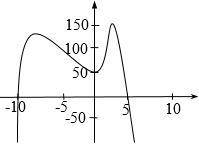
HELP PLZ AND THANKS The figure represents the graph of the function y=-x^4 -4x³ +14x² +14x -n which of the following could be the value of n? (A) -50 (B) -18 (C) 50 (D) 100 (E) 150

Answers: 3


Another question on Mathematics
Mathematics, 20.06.2019 18:04
Find equation of line with slope equals 8 and passing through (6,53)
Answers: 3
Mathematics, 21.06.2019 19:00
What is the percentile for data value 6 in the following data set? 4 13 8 6 4 4 13 6 4 13 2 13 15 5 9 4 12 8 6 13 40 25 35 62
Answers: 2
Mathematics, 21.06.2019 21:10
Identify the initial amount a and the growth factor b in the exponential function. a(x)=680*4.3^x
Answers: 2
Mathematics, 21.06.2019 22:00
In the sixth grade 13 out of 20 students have a dog if there are 152 sixth grade students how many of them have a dog
Answers: 2
You know the right answer?
HELP PLZ AND THANKS
The figure represents the graph of the function y=-x^4 -4x³ +14x² +14x -n which...
Questions
Mathematics, 24.09.2019 00:20

Mathematics, 24.09.2019 00:20
Mathematics, 24.09.2019 00:20

Chemistry, 24.09.2019 00:20

Mathematics, 24.09.2019 00:20

History, 24.09.2019 00:20
English, 24.09.2019 00:20
Mathematics, 24.09.2019 00:20

Computers and Technology, 24.09.2019 00:20


