
Mathematics, 18.03.2021 01:00 itzia00
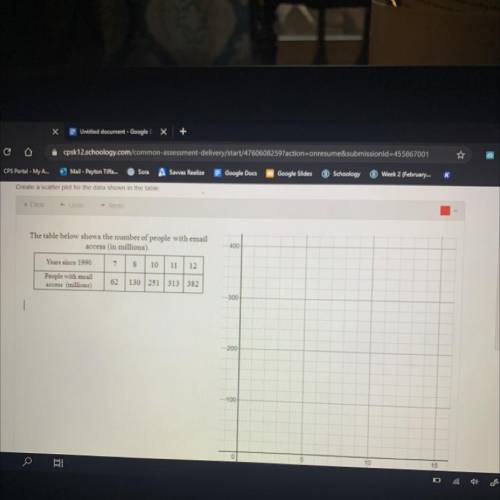
Create a scatter plot for the data shown in the table.
The table below shows the number of people with email
access (in millions).
Years since 1990 7 8 10 11 12
People with email
62 130 251 313 382
access (millions)
-300
-200
-100

Answers: 3


Another question on Mathematics
Mathematics, 21.06.2019 16:50
Ahiking trail is 6 miles long. it has 4 exercise stations, spaced evenly along the trail. what is the distance between each exercise station?
Answers: 3
Mathematics, 21.06.2019 20:00
Which type of graph would allow us to quickly see how many students between 100 and 200 students were treated?
Answers: 1
Mathematics, 21.06.2019 22:00
James is playing his favorite game at the arcade. after playing the game 33 times, he has 88 tokens remaining. he initially had 2020 tokens, and the game costs the same number of tokens each time. the number tt of tokens james has is a function of gg, the number of games he plays
Answers: 1
Mathematics, 22.06.2019 03:10
Aregular hexagonal pyramid has a base area of 45 in2 and a lateral area of 135in 2. what is the surface are are of the regular hexagonal pyramid
Answers: 2
You know the right answer?
Create a scatter plot for the data shown in the table.
The table below shows the number of people w...
Questions


Computers and Technology, 12.08.2019 16:20


Computers and Technology, 12.08.2019 17:10


