
Mathematics, 18.03.2021 01:10 DaisyHargrove23
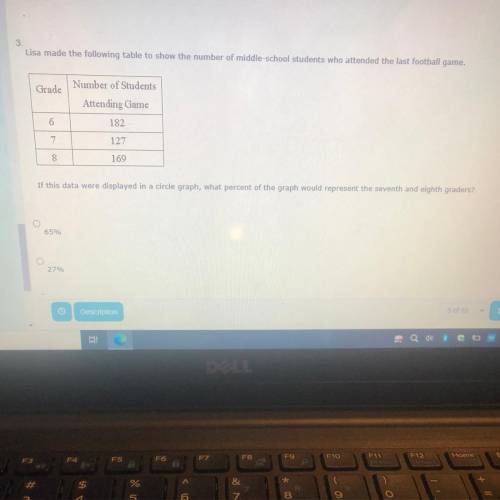
If this data were displayed in a circle graph, what percent of the graph would represent the seventh and eighth graders?
65%
27%
62%
38%

Answers: 1


Another question on Mathematics
Mathematics, 21.06.2019 21:30
Mario is constructing a frame for 10 in. by 8 in. photo. he wants the frame to be the same with all the way around in the same area of the frame and photo to be 120 square inches what is the dimension of the frame?
Answers: 1
Mathematics, 21.06.2019 23:30
Segment wx is shown explain how you would construct a perpendicular bisector of wx using a compass and a straightedge
Answers: 3
You know the right answer?
If this data were displayed in a circle graph, what percent of the graph would represent the seventh...
Questions

History, 07.12.2021 14:00
Mathematics, 07.12.2021 14:00
History, 07.12.2021 14:00
Mathematics, 07.12.2021 14:00
Mathematics, 07.12.2021 14:00

Mathematics, 07.12.2021 14:00
Mathematics, 07.12.2021 14:00

Physics, 07.12.2021 14:00

Biology, 07.12.2021 14:00

Mathematics, 07.12.2021 14:00
History, 07.12.2021 14:00


