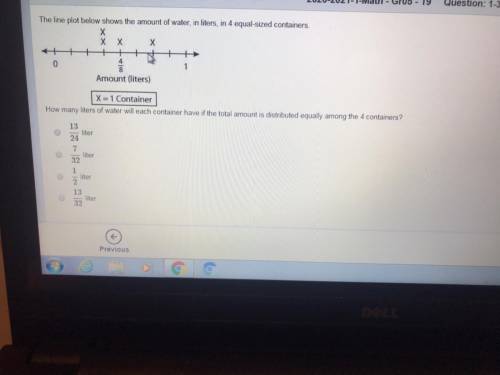
The line plot below shows the amount of water , in liters , in 4 equal- sized containers
...

Mathematics, 18.03.2021 01:40 nathancar
The line plot below shows the amount of water , in liters , in 4 equal- sized containers

Answers: 2


Another question on Mathematics
Mathematics, 22.06.2019 00:30
An unknown number x is at most 10. which graph best represents all the values of x? number line graph with closed circle on 10 and shading to the right. number line graph with open circle on 10 and shading to the right. number line graph with open circle on 10 and shading to the left. number line graph with closed circle on 10 and shading to the left.
Answers: 1
Mathematics, 22.06.2019 01:10
Farmers know that driving heavy equipment on wet soil compresses the soil and injures future crops. here are data on the "penetrability" of the same type of soil at two levels of compression. penetrability is a measure of how much resistance plant roots will meet when they try to grow through the soil. compressed soil 2.85 2.66 3 2.82 2.76 2.81 2.78 3.08 2.94 2.86 3.08 2.82 2.78 2.98 3.00 2.78 2.96 2.90 3.18 3.16 intermediate soil 3.17 3.37 3.1 3.40 3.38 3.14 3.18 3.26 2.96 3.02 3.54 3.36 3.18 3.12 3.86 2.92 3.46 3.44 3.62 4.26 use the data, omitting the high outlier, to give a 95% confidence interval for the decrease in penetrability of compressed soil relative to intermediate soil. compute degrees of freedom using the conservative method. interval: to
Answers: 1
Mathematics, 22.06.2019 05:20
Analyze the diagram. what is the composition of transformations that was applied to map wxyz to w''x''y''z''? the first transformation was a reflection across line m rotation about point a translation down and right translation up and left. the second transformation was a rotation about point a translation up translation down reflection across line m.
Answers: 1
You know the right answer?
Questions

Computers and Technology, 20.12.2019 21:31


Computers and Technology, 20.12.2019 21:31


