
Mathematics, 18.03.2021 02:10 w210138937
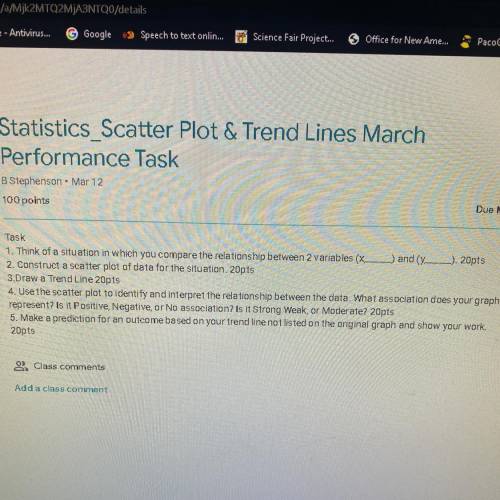
1. Think of a situation in which you compare the relationship between 2 variables (x,_) and (y,_). 20pts
2. Construct a scatter plot of data for the situation. 20pts
3.Draw a Trend Line 20pts
4. Use the scatter plot to identify and interpret the relationship between the data. What association does your graph represent? Is it Positive, Negative, or No association? Is it Strong Weak, or Moderate? 20pts
5. Make a prediction for an outcome based on your trend line not listed on the original graph and show your work. 20pts

Answers: 2


Another question on Mathematics
Mathematics, 21.06.2019 20:50
An automobile assembly line operation has a scheduled mean completion time, μ, of 12 minutes. the standard deviation of completion times is 1.6 minutes. it is claimed that, under new management, the mean completion time has decreased. to test this claim, a random sample of 33 completion times under new management was taken. the sample had a mean of 11.2 minutes. assume that the population is normally distributed. can we support, at the 0.05 level of significance, the claim that the mean completion time has decreased under new management? assume that the standard deviation of completion times has not changed.
Answers: 3
Mathematics, 22.06.2019 02:00
Polygon abcd is a parallelogram, and m? abc = 127°. the length of is 10 units, and the length of is 5 units. the perimeter of the parallelogram is units, and m? bcd is °
Answers: 3
Mathematics, 22.06.2019 03:30
Simplify the expression 8h - 57-3m by adding or subtracting the like term
Answers: 1
Mathematics, 22.06.2019 04:30
Whats the area of a square is 16 cm square. the square is the base of a cube. what is the surface area of the a. 16cm2 b. 32cm2 c. 64cm2 d. 96cm2
Answers: 2
You know the right answer?
1. Think of a situation in which you compare the relationship between 2 variables (x,_) and (y,_). 2...
Questions

Business, 08.12.2020 16:40


Mathematics, 08.12.2020 16:40

Mathematics, 08.12.2020 16:40

Computers and Technology, 08.12.2020 16:40

English, 08.12.2020 16:40
Mathematics, 08.12.2020 16:40


