1. The scatter plot shows the
relationship between the fat (grams)
and total calories in diff...

Mathematics, 18.03.2021 02:30 hallmansean04
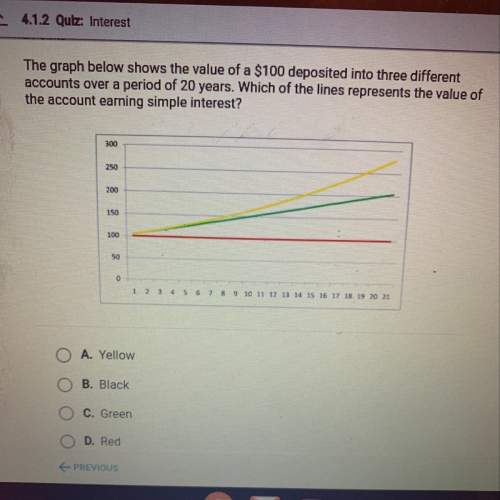
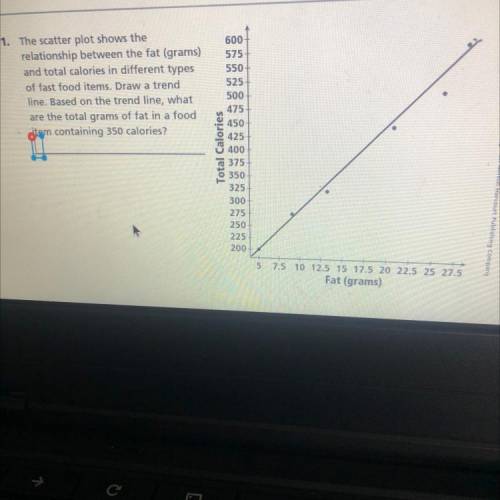
1. The scatter plot shows the
relationship between the fat (grams)
and total calories in different types
of fast food items. Draw a trend
line. Based on the trend line, what
are the total grams of fat in a food item containing 350 calories?

Answers: 1


Another question on Mathematics
Mathematics, 21.06.2019 16:30
Amuffin recipe, which yields 12 muffins, calls for cup of milk for every 1 cups of flour. the same recipe calls for cup of coconut for every cup of chopped apple. to yield a batch of 30 muffins, how much flour will be needed in the mix?
Answers: 1
Mathematics, 21.06.2019 23:00
During a wright loss challenge your friend goes from 125 pounds to 100 pounds.what was the percent weight loss
Answers: 2
You know the right answer?
Questions
Mathematics, 20.09.2020 15:01

Mathematics, 20.09.2020 15:01


Health, 20.09.2020 15:01
Chemistry, 20.09.2020 15:01
Mathematics, 20.09.2020 15:01

Chemistry, 20.09.2020 15:01
Mathematics, 20.09.2020 15:01
History, 20.09.2020 15:01


