
Mathematics, 18.03.2021 03:20 rubimachuca1020
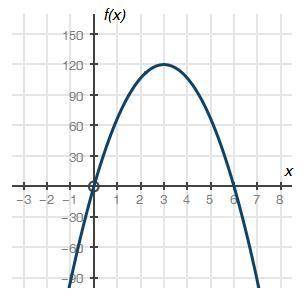
The graph below shows a company's profit f(x), in dollars, depending on the price of goods x, in dollars, being sold by the company
Part A: What do the x-intercepts and maximum value of the graph represent?
Part B: What are the intervals where the function is increasing and decreasing, and what do they represent about the sale and profit?
Part C: What is an approximate average rate of change of the graph from x = 1 to x = 3, and what does this rate represent?

Answers: 1


Another question on Mathematics
Mathematics, 20.06.2019 18:04
Antonio made a scale model of a building. the model's scale is 1 inch to 235 feet and its height is 3.5 inches. what is the exact height of the actual building? enter your answer in the box.
Answers: 1
Mathematics, 21.06.2019 14:00
The deck that kenneth is building is in the shape of a parallelogram abcd the measure of angle c is one third the measure of angle b find the measure of each angle of the deck
Answers: 2
Mathematics, 21.06.2019 19:30
Joel wants to buy a new tablet computer fram a store having a 20% off sale on all tablets. the tablet he wants has an original cost of $190. he also wants to make sure he has enough money to pay the 5% sales tax. part one joel uses the incorect expression 0.95(190)(0.8) to calculate that the tablet will cost him a total of $144.40. describe his error and write the correct expression part two how much will joel pay for the tablet show your work if you answer this question correctly you will receive a prize of 99 points good luck
Answers: 2
You know the right answer?
The graph below shows a company's profit f(x), in dollars, depending on the price of goods x, in dol...
Questions
Mathematics, 04.08.2019 15:30

English, 04.08.2019 15:30
Mathematics, 04.08.2019 15:30


Mathematics, 04.08.2019 15:30
Mathematics, 04.08.2019 15:30


Biology, 04.08.2019 15:30


Biology, 04.08.2019 15:30
English, 04.08.2019 15:30


